add2boxplot

add2boxplot adds labels to the boxplot figure

Syntax

Description

add2boxplot assumes that one or more boxplots have been created using function boxplot. This function adds to the plot the labels associated with the outliers. Note that Y and g must have exactly the same dimensions to those called by boxplot. Note also that if Y is the associated table, the labels are referred to the rownames of Y.

example

add2boxplot(Y) Example 1: Y vector and no groups.

example

add2boxplot(Y, g) Example 2: Y matrix and no groups.

Examples

expand all

  • Example 1: Y vector and no groups.
  • boxplot is called with input variable Y as a vector and there is no grouping variable.

    rng(2)
    y=randn(1300,1);
    boxplot(y)
    add2boxplot(y);
    % Note that the input argument of add2boxplot could be a table
    % ytable=array2table(y);
    % add2boxplot(ytable);

  • Example 2: Y matrix and no groups.
  • boxplot is called with input variable Y as a matrix and there is no grouping variable.

    rng(2)
    y=randn(300,5);
    boxplot(y)
    add2boxplot(y);

    Related Examples

    expand all

  • Example 3: Y vector and there are groups.
  • boxplot is called with input variable Y as a vector and there is a grouping variable.

    load fisheriris
    boxplot(meas(:,1),species)
    add2boxplot(meas(:,1),species)

  • Example 4: Y matrix and there are groups.
  • boxplot is called with input variable Y as a matrix and there is a grouping variable

    Y=trnd(5,100,4);
    % define the grouping variable.
    g={'zz';'bb';'cc'; 'dd'};
    boxplot(Y,g)
    add2boxplot(Y,g)
    Click here for the graphical output of this example (link to Ro.S.A. website)

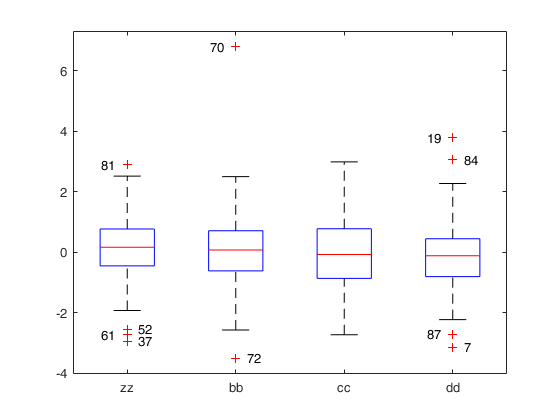
  • An example where Y is table.
  • load dataset referred to Italian cities about quality of life.

    load citiesItaly.mat
    Yst=citiesItaly;
    Yst{:,:}=zscore(citiesItaly{:,:});
    boxplot(Yst{:,:},'Labels',citiesItaly.Properties.VariableNames,'Jitter',0);
    add2boxplot(Yst)
    Click here for the graphical output of this example (link to Ro.S.A. website)

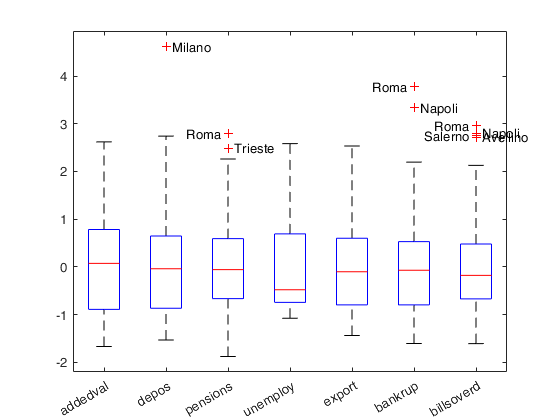
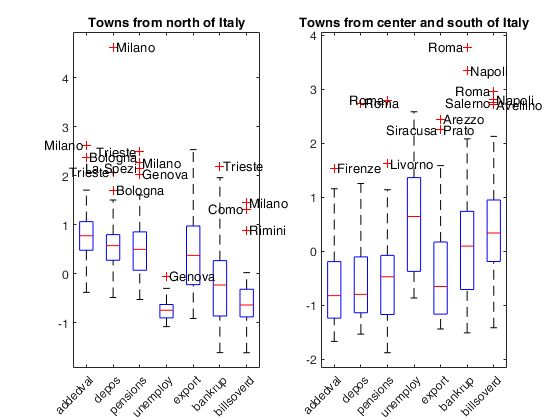
  • An example where Y is table and there are subplots.
  • load citiesItaly.mat
    close all
    citiesItaly{:,:}=zscore(citiesItaly{:,:});
    subplot(1,2,1)
    Yst=citiesItaly{1:46,:};
    Ystt=citiesItaly(1:46,:);
    boxplot(Yst,'Labels',citiesItaly.Properties.VariableNames,'Jitter',0);
    add2boxplot(Ystt)
    title("Towns from north of Italy")
    subplot(1,2,2)
    Yst1=citiesItaly{47:end,:};
    Yst1t=citiesItaly(47:end,:);
    boxplot(Yst1,'Labels',citiesItaly.Properties.VariableNames,'Jitter',0);
    add2boxplot(Yst1t)
    title("Towns from center and south of Italy")
    Click here for the graphical output of this example (link to Ro.S.A. website)

    Input Arguments

    expand all

    Y — Input data. Vector or matrix or table.

    This is the first input argument which has been passed to function boxplot. Note that while boxplot requires an array, Y can also be a table with the same rows and columns to that passed to boxplot.

    Data Types: single|double

    Optional Arguments

    g — Grouping variable. This is exactly equal to g which has been supplied to function boxplot.

    Example: [ones(10,1);ones(20,1)]

    Data Types: numeric vector | character array | string array | cell array | categorical array

    Output Arguments

    References

    See Also

    This page has been automatically generated by our routine publishFS