barVariableWidth
barVariableWidth produces a bar plot with different widths and colors for each bar
Syntax
Description
Examples
 Example in stackoverflow.
Example in stackoverflow.https://stackoverflow.com/questions/18419339/how-to-plot-bar-with-different-height-and-differenth-width-in-matlab
close all
x = [0.5 0.6 0.9 1 1.2 1.8];
dy = [1 3 2 .5 .1];
barVariableWidth(dy,x)
xlabel('Time')
ylabel('Prob density')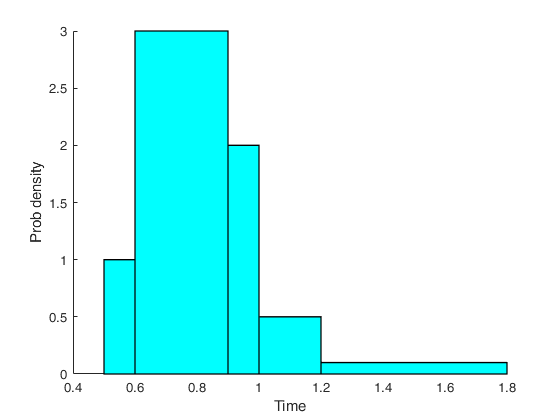
Related Examples
Example in stackoverflow (different colors).
Example in stackoverflow (different colors).https://stackoverflow.com/questions/18419339/how-to-plot-bar-with-different-height-and-differenth-width-in-matlab
close all
x = [0.5 0.6 0.9 1 1.2 1.8];
dy = [1 3 2 .5 .1];
barVariableWidth(dy,x,'Color',1:5)
xlabel('Time')
ylabel('Prob density')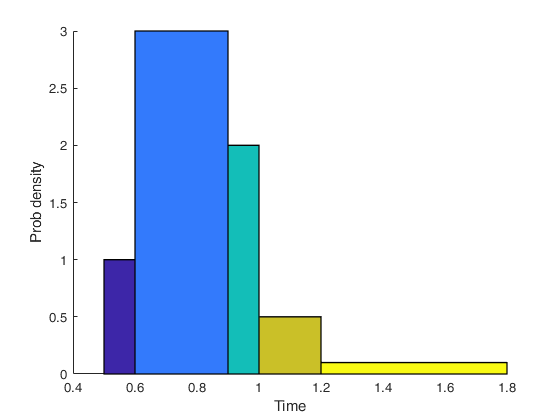
Example in stackoverflow (option FaceAlpha).
Example in stackoverflow (option FaceAlpha).https://stackoverflow.com/questions/18419339/how-to-plot-bar-with-different-height-and-differenth-width-in-matlab
close all
x = [0.5 0.6 0.9 1 1.2 1.8];
dy = [1 3 2 .5 .1];
barVariableWidth(dy,x,'FaceAlpha',0.1)
xlabel('Time')
ylabel('Prob density')
title('Option ''FaceAlpha''')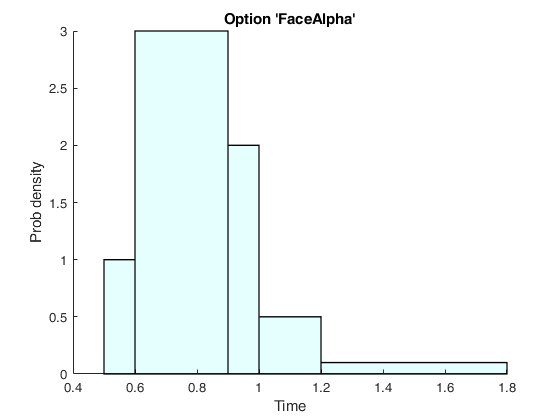
Example in stackoverflow (option LineWidth).
Example in stackoverflow (option LineWidth).https://stackoverflow.com/questions/18419339/how-to-plot-bar-with-different-height-and-differenth-width-in-matlab
close all
x = [0.5 0.6 0.9 1 1.2 1.8];
dy = [1 3 2 .5 .1];
barVariableWidth(dy,x,'LineWidth',3)
xlabel('Time')
ylabel('Prob density')
title('Option ''LineWidth''')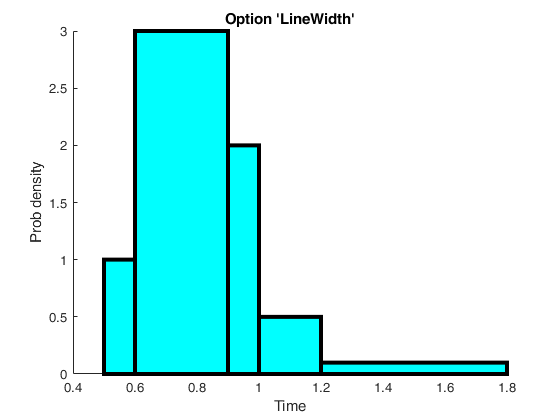
Example in stackoverflow (option EdgeColor).
Example in stackoverflow (option EdgeColor).https://stackoverflow.com/questions/18419339/how-to-plot-bar-with-different-height-and-differenth-width-in-matlab
close all
x = [0.5 0.6 0.9 1 1.2 1.8];
dy = [1 3 2 .5 .1];
barVariableWidth(dy,x,'EdgeColor','r')
xlabel('Time')
ylabel('Prob density')
title('Option ''EdgeColor''')
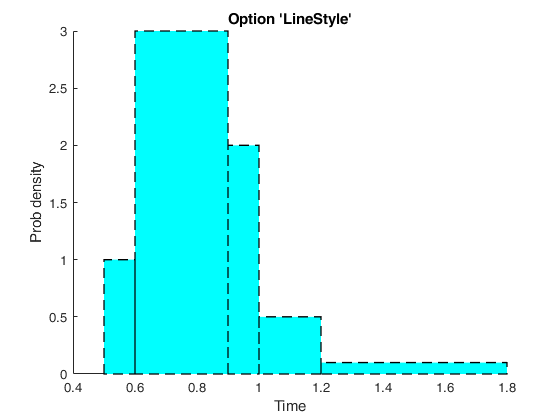
Example in stackoverflow (option LineStyle).
Example in stackoverflow (option LineStyle).https://stackoverflow.com/questions/18419339/how-to-plot-bar-with-different-height-and-differenth-width-in-matlab
close all
x = [0.5 0.6 0.9 1 1.2 1.8];
dy = [1 3 2 .5 .1];
barVariableWidth(dy,x,'LineStyle','--')
xlabel('Time')
ylabel('Prob density')
title('Option ''LineStyle''')