cabc
cabc closes all open figures except the one in foreground (the current)
Syntax
cabc()example
Examples
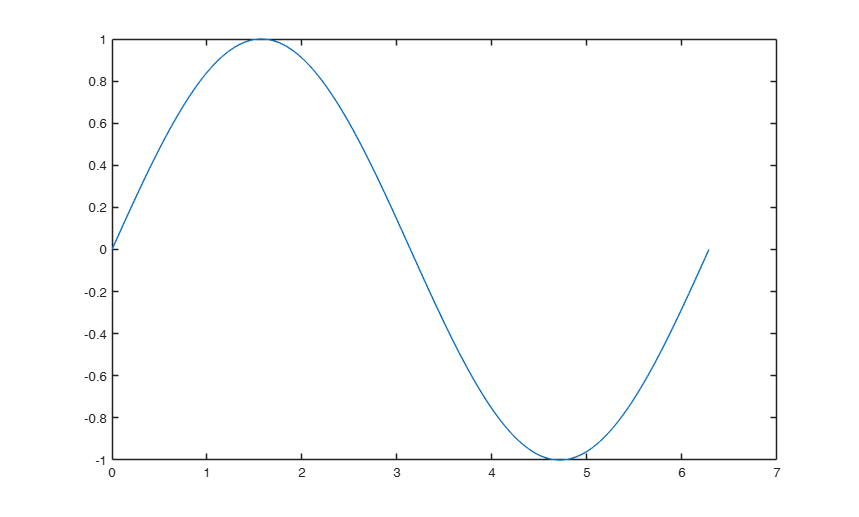
 Plot sin, cos and atan in the interval 0 2pi.
Plot sin, cos and atan in the interval 0 2pi.
x = 0:pi/1000:2*pi;
plot(x,sin(x));
figure
plot(x,cos(x));
figure
plot(x,atan(x))
cascade
% Now highlight a figure and then digit
cabc
% All the other figures but the one which has been selected will be
% closed
Related Examples
Input Arguments
Output Arguments
References
Tufte E.R. (1983), "The visual display of quantitative information", Graphics Press, Cheshire.