scatterboxplot
scatterboxplot creates scatter diagram with marginal boxplots
Description
scatterboxplot displays a 2D scatter plot with marginal boxplots. It receives data in two vectors X and Y, and puts a univariate boxplot on the horizontal and vertical axes of the plot. x and y must have the same length. All the name pairs in function scatterhist such as 'Location', 'Group', 'PlotGroup',... can be used inside this function.
A 2D scatter plot with marginal boxplots, for grouped data.h
=scatterboxplot(x,
y,
Name, Value)
Examples
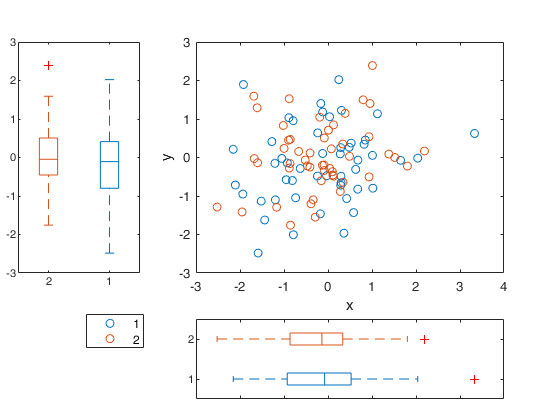
 A 2D scatter plot with marginal boxplots, for grouped data.
A 2D scatter plot with marginal boxplots, for grouped data.
n=100; group=ones(n,1);
group(1:50)=2; scatterboxplot(randn(n,1),randn(n,1),'Group',group);
Related Examples
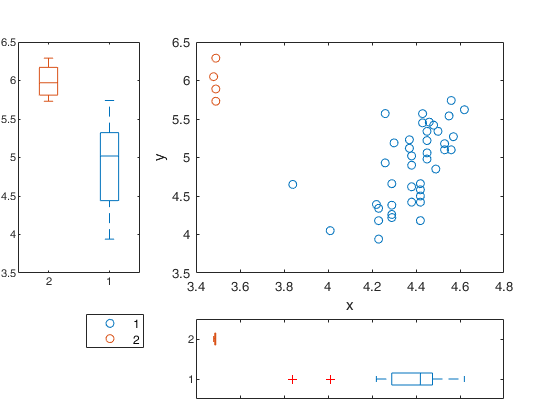
scatterboxplot for the stars data.
scatterboxplot for the stars data.
Y=load('stars.txt');
x=Y(:,1); y=Y(:,2);
out=FSR(y,x,'plots',0);
group=ones(length(x),1);
group(out.outliers)=2;
scatterboxplot(Y(:,1),Y(:,2),'Group',group);
-------------------------
Signal detection loop
Signal in final part of the search: step 43 because
rmin(43,47)>99% at final step: Bonferroni signal in the final part of the search.
rmin(43,47)>99.999%
------------------------------------------------
-------------------
Signal validation exceedance of upper envelopes
Validated signal
-------------------------------
Start resuperimposing envelopes from step m=42
Superimposition stopped because r_{min}(43,44)>99% envelope
$r_{min}(43,44)>99$\% envelope
----------------------------
Final output
Number of units declared as outliers=4
Summary of the exceedances
1 99 999 9999 99999
0 2 2 1 1