mdLittleTest Little's test for Missing Completely At Random (MCAR).
Little's test assesses the null hypothesis that the missing-data mechanism is Missing Completely At Random (MCAR). The test is based on pattern-specific mean deviations from the global maximum likelihood estimate of the mean vector, using the corresponding submatrices of the global covariance matrix.
Example 2: Supply EM estimates externally.out
=mdLittleTest(Y,
Name, Value)
Example 1: Little's MCAR test with default options.Generate a data matrix with missing values and run the test using the internal EM estimates.
rng(1); Y = randn(100,3); Y(rand(100,3)<0.15) = NaN; out = mdLittleTest(Y); disp(out)
stat: 10.7470
df: 9
pvalue: 0.2935
loc: [3×1 double]
cov: [3×3 double]
patterns: [7×3 logical]
npatterns: 7
patternInfo: [7×4 table]
Example 2: Supply EM estimates externally.First compute the EM estimates using mdEM, then pass them to mdLittleTest.
rng(2); Y = randn(150,4); Y(rand(150,4)<0.20) = NaN; outEM = mdEM(Y); out = mdLittleTest(Y,'emOut',outEM); disp(out.stat) disp(out.pvalue)
32.5429
0.2126
Example 3: Inspect missingness patterns.The output contains the distinct observed-data patterns and a table with information about the informative patterns.
rng(4); Y = randn(120,4); Y(1:30,1) = NaN; Y(31:60,2) = NaN; Y(61:90,[3 4]) = NaN; out = mdLittleTest(Y); disp(out.patterns) disp(out.patternInfo)
0 1 1 1
1 0 1 1
1 1 0 0
1 1 1 1
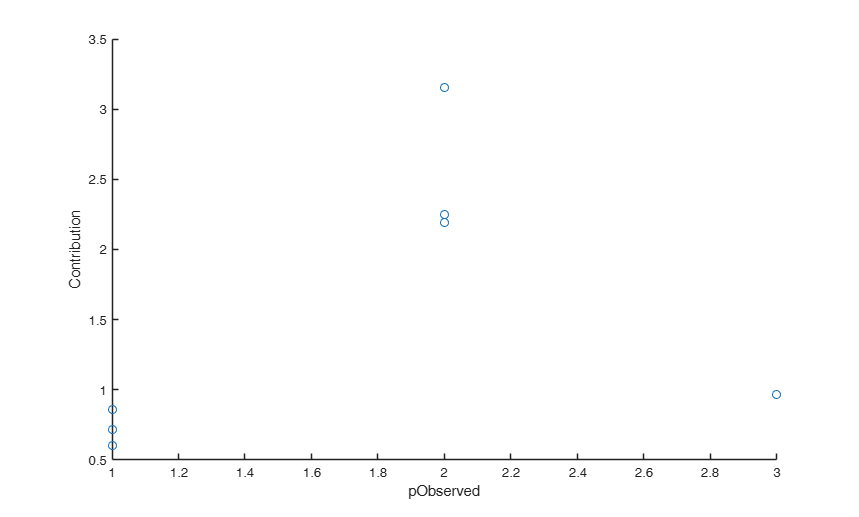
nPattern pObserved Contribution CondSigma
________ _________ ____________ _________
0111 30 3 3.8363 1.7095
1011 30 3 5.3496 1.2466
1100 30 2 0.20649 1.4472
1111 30 4 1.924 1.9194
Rows with all variables missing are ignored in the computation of Little's statistic.
rng(5); Y = randn(80,3); Y(rand(80,3)<0.15) = NaN; Y(1:5,:) = NaN; out = mdLittleTest(Y); disp(out.npatterns) disp(out.stat)
Y — Input data.
Array or table.n x p data matrix; n observations and p variables possibly containing missing values (NaN's).
Rows of Y represent observations, and columns represent variables.
Data Types: single | double
Specify optional comma-separated pairs of Name,Value arguments.
Name is the argument name and Value
is the corresponding value. Name must appear
inside single quotes (' ').
You can specify several name and value pair arguments in any order as
Name1,Value1,...,NameN,ValueN.
'emOut',outEM
, 'maxiter',100
, 'plots',true
, 'tol',1e-6
emOut
—Structure containing EM estimates.if supplied, it must contain fields: emOut.loc : p x 1 estimated mean vector emOut.cov: p x p estimated covariance matrix If empty, function mdEM is called internally.
Default is [].
Example: 'emOut',outEM
Data Types: struct
maxiter
—Maximum number of iterations for mdEM.used only if option 'emOut' is empty.Default is 200.
Example: 'maxiter',100
Data Types: single | double
plots
—Produce a graphical summary of the missingness patterns.boolean.If true, the patterns having the largest percentage contributions to Little's statistic are displayed in decreasing order. The percentage for pattern $r$ is $100T_r/T$, where $T_r$ is its individual contribution and $T$ is Little's overall statistic.
At most the ten most important informative patterns are shown. The default is false.
Example: 'plots',true
Data Types: logical | single | double
tol
—Convergence tolerance for mdEM.used only if option 'emOut' is empty.Default is 1e-7.
Example: 'tol',1e-6
Data Types: single | double
out — description
StructureStructure containing the following fields:
| Value | Description |
|---|---|
stat |
Little's test statistic. |
df |
Degrees of freedom of the chi-square reference distribution. |
pvalue |
p-value of the test. |
loc |
Global MLE of the mean vector (from EM). |
cov |
Global MLE of the covariance matrix (from EM). |
npatterns |
Number of distinct missingness patterns. |
patterns |
R x p logical matrix. Each row is a distinct missingness pattern; true means observed entry. R is the number of distinct missingness patterns. |
patternInfo |
Table with one row for each distinct missingness pattern. Row names encode the observed variables: for example, with five variables, row name 11000 indicates that only variables 1 and 2 are observed. The columns are: nPattern = number of observations in the pattern; pObserved = number of observed variables; Contribution= contribution to Little's statistic; CondSigma = condition number of the covariance submatrix used for that pattern. |
Let $r=1,...,R$ index the distinct missingness patterns. For pattern $r$, let $n_r$ be the number of units following that pattern, let $p_r$ be the number of observed variables in that pattern, and let $\bar{y}_r$ be the sample mean vector computed using the observed variables only. Let $\hat{\mu}$ and $\hat{\Sigma}$ be the global maximum likelihood estimates under multivariate normality, typically obtained by EM. Denote by $\hat{\mu}_r$ and $\hat{\Sigma}_r$ the subvector and submatrix corresponding to the variables observed in pattern $r$. Little's statistic is \[ T = \sum_{r=1}^{R} n_r (\bar{y}_r-\widehat{\mu}_r)^{\mathsf T} \widehat{\Sigma}_r^{-1} (\bar{y}_r-\widehat{\mu}_r). \] Under the null hypothesis of MCAR, T is asymptotically distributed as a chi-square random variable with degrees of freedom \[ \mathrm{df} = \sum_{r=1}^{R}p_r-p. \]
where $p$ is the total number of variables.
If option plots is true, patterns are ranked according to their individual contributions to Little's statistic. Thus, a pattern is regarded as more important when
\[ T_r = n_r (\bar{y}_r-\widehat{\mu}_r)^{\mathsf T} \widehat{\Sigma}_r^{-1} (\bar{y}_r-\widehat{\mu}_r) \]is large. The plot therefore identifies the missingness patterns that contribute most strongly to the overall evidence against MCAR.
Rows with all variables missing do not contribute to the test statistic.
Little, R. J. A. (1988), "A Test of Missing Completely at Random for Multivariate Data with Missing Values", Journal of the American Statistical Association, 83, pp. 1198-1202.
mdEM
|
mdPartialMD
|
mdMAARtest
|
mdJJtest