geoplotFS

geoplotFS calls geoplotAPP.mlapp to show an interactive geoplot with polygons

Syntax

  • geoplotFS(Y,score,ShapeFile)example
  • geoplotFS(Y,score,ShapeFile,Name,Value)example

Description

In the app it is also possible choose the variable of Y to show, the type of plot (i.e. in latitude and longitude coordinates or in the original coordinates of ShapeFile), the direction of the colorbar.

Note that this function requires that the "mapping toolbox" is installed.

example

geoplotFS(Y, score, ShapeFile) Example where second input argument is a numeric scalar.

example

geoplotFS(Y, score, ShapeFile, Name, Value) Example where second input argument is a string.

Examples

expand all

  • Example where second input argument is a numeric scalar.
  • a=struct2table(ver);
    MappingInstalled=any(string(a{:,1})=="Mapping Toolbox");
    if MappingInstalled ==true
    load citiesItaly2024.mat
    X=citiesItaly2024;
    ShapeFile=X.Properties.UserData{1};
    % Show the geoplot of the third variable of table X
    geoplotFS(X,3,ShapeFile)
    else
    disp('This function requires the "mapping toolbox" is installed') 
    end
    Click here for the graphical output of this example (link to Ro.S.A. website).

  • Example where second input argument is a string.
  • load citiesItaly2024.mat
    X=citiesItaly2024;
    ShapeFile=X.Properties.UserData{1};
    geoplotFS(X,"QualLif",ShapeFile)
    Click here for the graphical output of this example (link to Ro.S.A. website).

    Related Examples

    expand all

  • Example where second input argument is a character.
  • load citiesItaly2024.mat
    X=citiesItaly2024;
    ShapeFile=X.Properties.UserData{1};
    geoplotFS(X,'SpendingA',ShapeFile)
    Click here for the graphical output of this example (link to Ro.S.A. website)

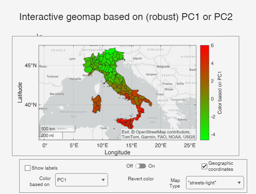
  • Example where second input argument is a matrix.
  • load citiesItaly2024.mat
    X=citiesItaly2024;
    out=pcaFS(X,'biplot',0,'dispresults',0,'plots',0);
    ShapeFile=X.Properties.UserData{1};
    % Color based on PCs
    geoplotFS(X,out.score,ShapeFile)
    The first PC already explains more than 0.95^v variability
    In what follows we still extract the first 2 PCs
    
    Click here for the graphical output of this example (link to Ro.S.A. website)

  • Example of use of option bsb.
  • load citiesItaly2024.mat
    X=citiesItaly2024;
    out=pcaFS(X,'biplot',0,'dispresults',0,'plots',0);
    ShapeFile=X.Properties.UserData{1};
    % Color based on PCs and use of option bsb
    % Select the provinces of Emilia-Romagna
    bsb=[33:40 99];
    geoplotFS(X,out.score,ShapeFile,'bsb',bsb)
    The first PC already explains more than 0.95^v variability
    In what follows we still extract the first 2 PCs
    
    Click here for the graphical output of this example (link to Ro.S.A. website)

    Input Arguments

    expand all

    Y — Input data. 2D array or table.

    n x v data matrix; n observations and v variables. Rows of Y represent observations, and columns represent variables.

    Missing values (NaN's) and infinite values (Inf's) are allowed, since observations (rows) with missing or infinite values will automatically be excluded from the computations.

    Data Types: single|double

    score — variable to show or nxp matrix containing variables to show. Numeric scalar, of string or character identifying the initial variable to use in the geoplot.

    Alternatively, score can contain a nxp array for example with the p principal components Example - 'ShapeFile','shapefileName'

    Data Types: char or string numeric scalar or nxp array.

    ShapeFile — name of ShapeFile or geotable containing shapes. Character or string or geotable.

    Name of the ShapeFile containing the containing the geometric details of the rows. The ShapeFile, which is loaded using function readgeotable, must have n rows and the n rows must have the same order of the n rows of Y.

    Remark: note that this option can be used just if the "Mapping toolbox" is installed.

    Example - 'ShapeFile','shapefileName'

    Data Types: char or string or geotable.

    Name-Value Pair Arguments

    Specify optional comma-separated pairs of Name,Value arguments. Name is the argument name and Value is the corresponding value. Name must appear inside single quotes (' '). You can specify several name and value pair arguments in any order as Name1,Value1,...,NameN,ValueN.

    Example: 'bsb',1:20

    bsb —list of units forming the initial subset.vector.

    If bsb is not specified all unis are considered

    Example: 'bsb',1:20

    Data Types: single|double

    Output Arguments

    References

    See Also

    This page has been automatically generated by our routine publishFS