n x p data matrix; n observations and p variables. Rows of
Y represent observations, and columns represent variables.
Data Types: single|double
Specify optional comma-separated pairs of Name,Value arguments.
Name is the argument name and Value
is the corresponding value. Name must appear
inside single quotes (' ').
You can specify several name and value pair arguments in any order as
Name1,Value1,...,NameN,ValueN.
Example:
 'DataVars',[2 4 5]
, 'conflev',0.99
, 'AddAxes',[false false true]
, 'AddConstantPlane',false
, 'LineWidthAxes',1
, 'standardize',false
, 'TextDensityPercentage',80
For examples if 'DataVars' is [3 5 6],
PCA is done for variables 3, 5 and 6. If 'DataVars' is
["Name1" "Name4" "Name8"] variable with these names inside the
input table are used. Note that if DataVars is not
specified the first 3 variables are used.
Example: 'DataVars',[2 4 5]
Data Types: character vector | string array | cell array of character vectors | vector of positive integers | logical vector
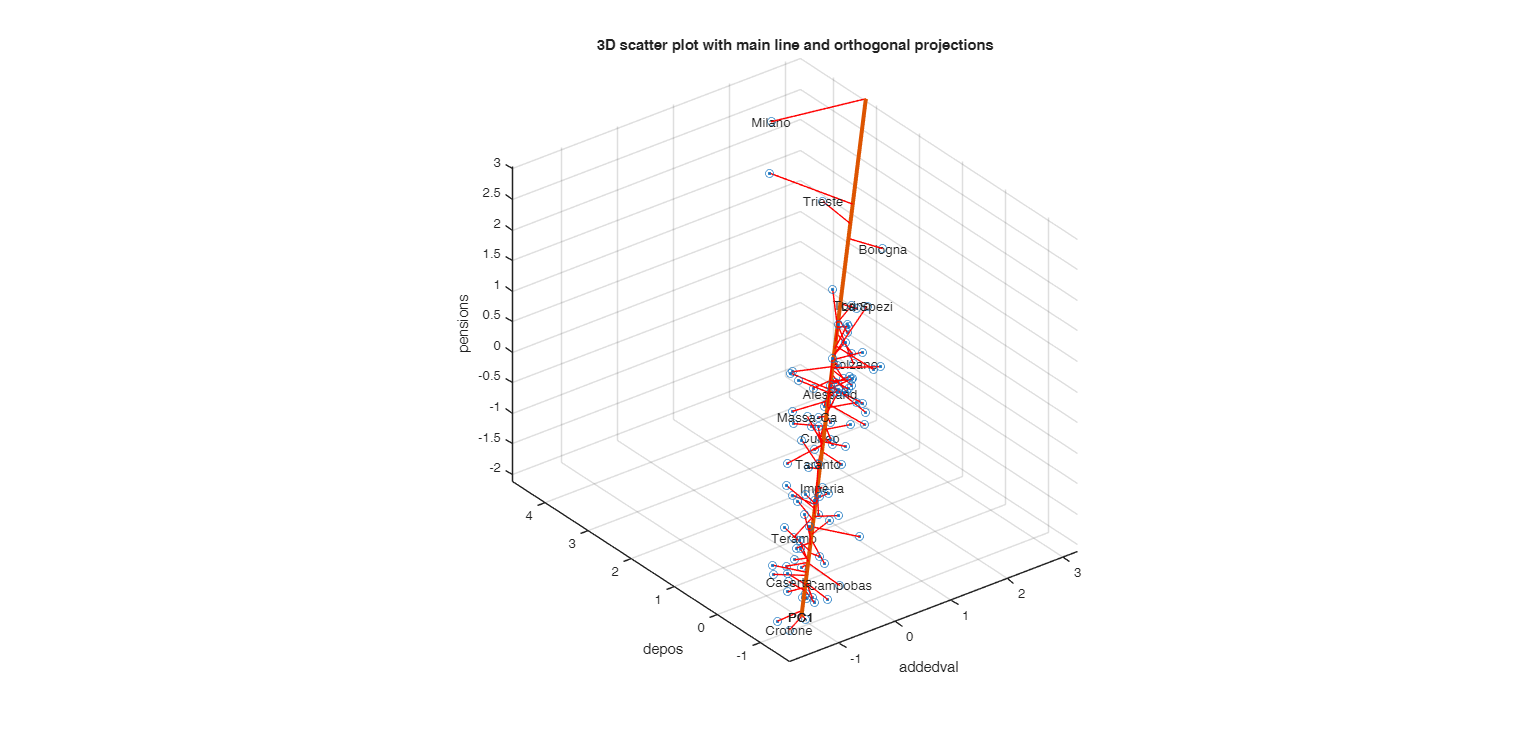
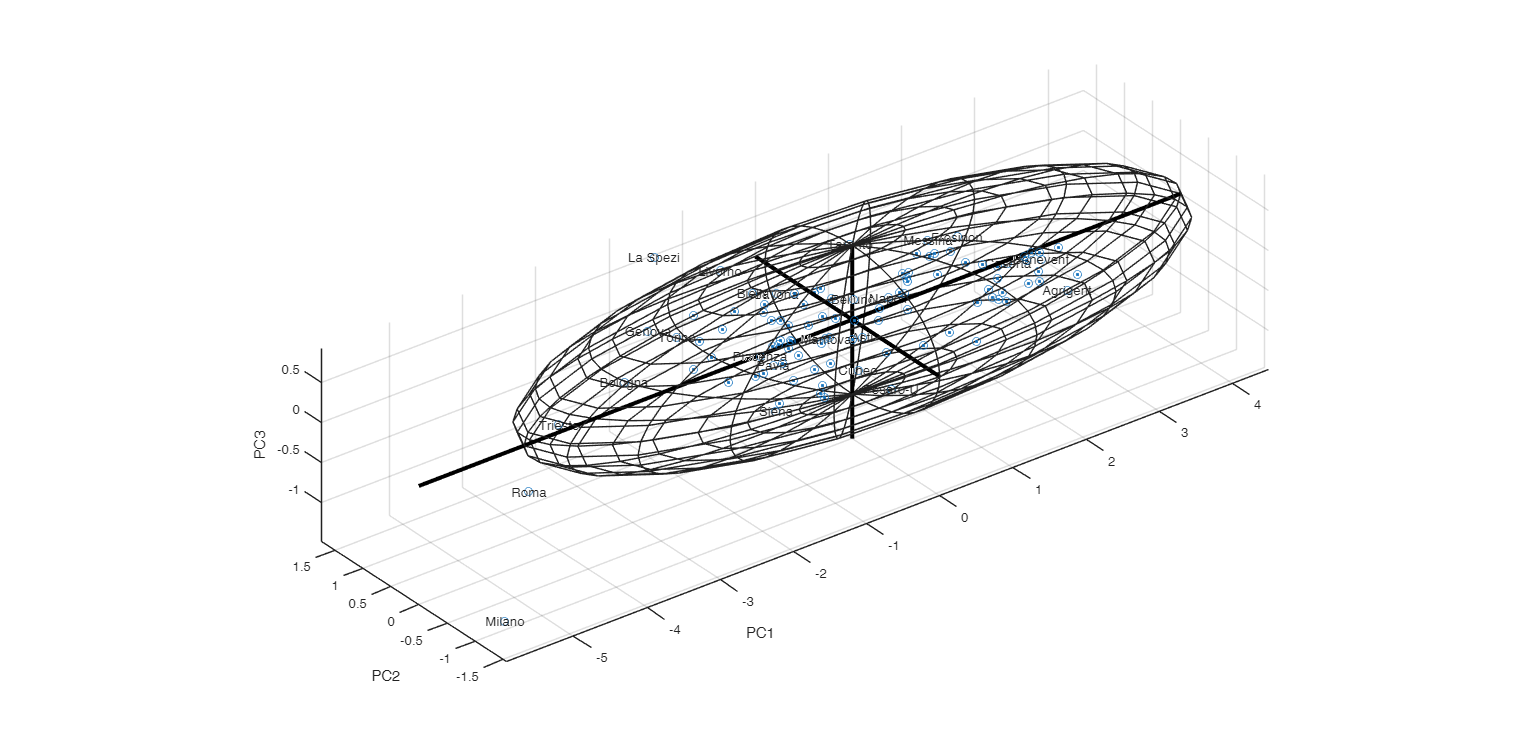
A number in the interval (0 1)
which specifies the confidence level of the ellipsoid which encloses
the points. The confidence level is computed under normality assumption
and it is based on the chi2 with 3 degrees of freedom.
Example: 'conflev',0.99
Data Types: single, double
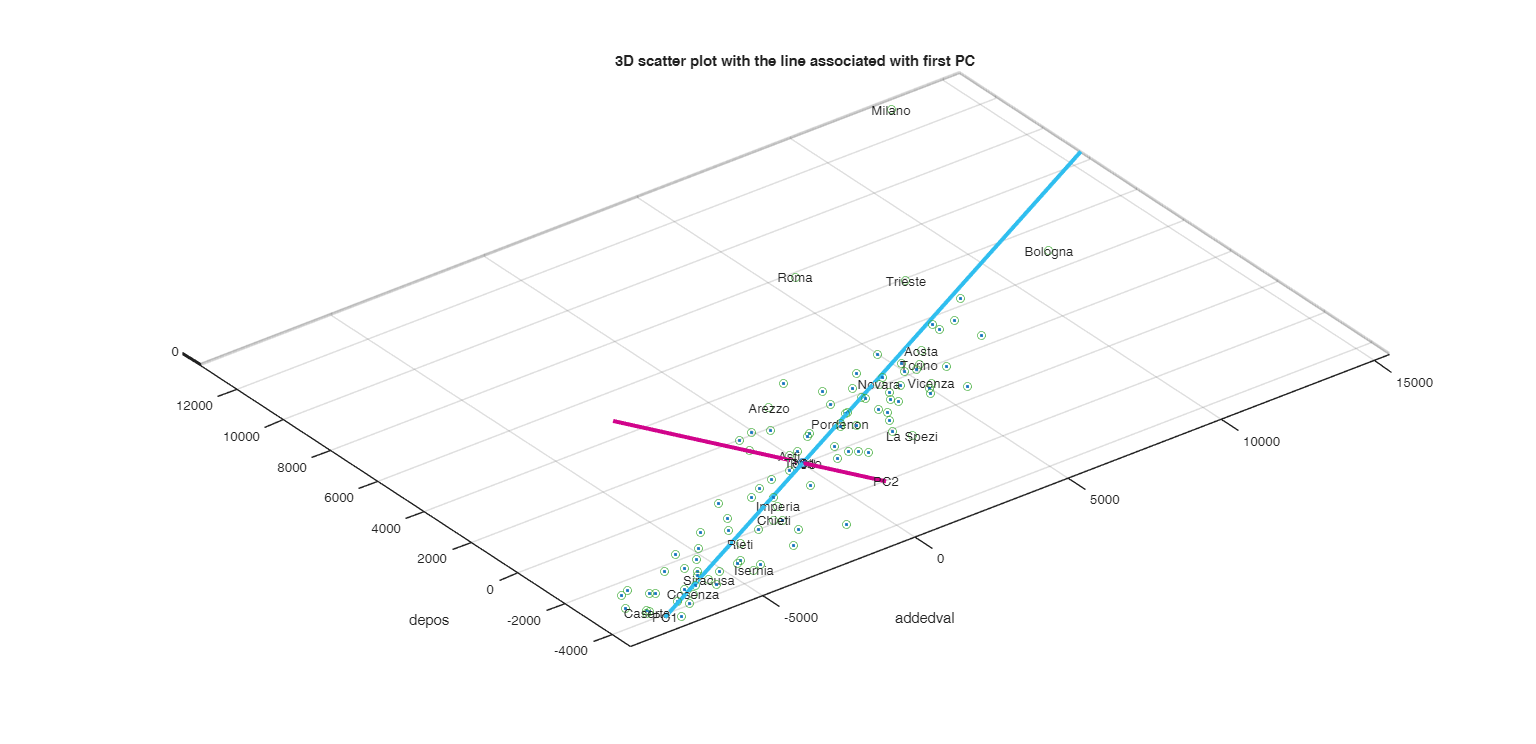
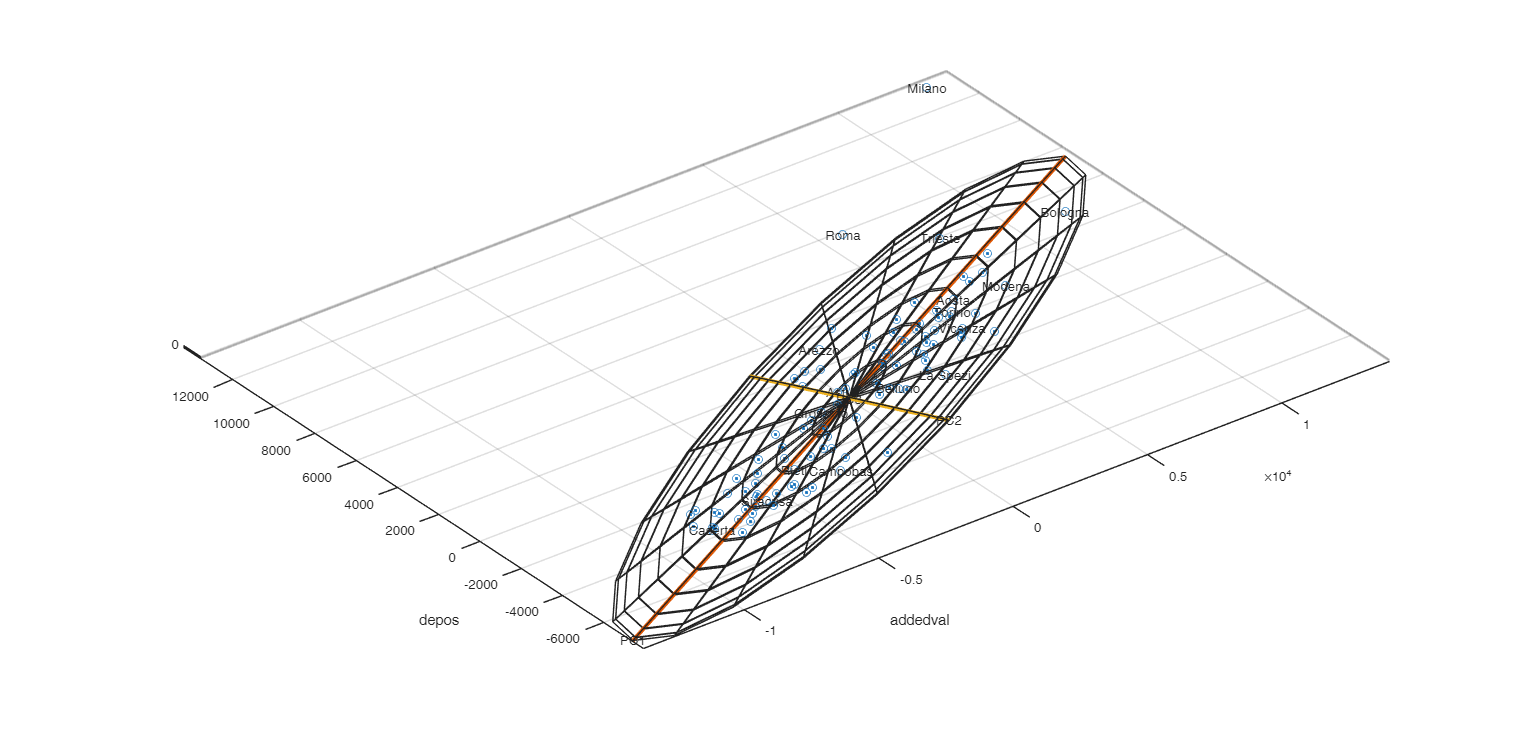
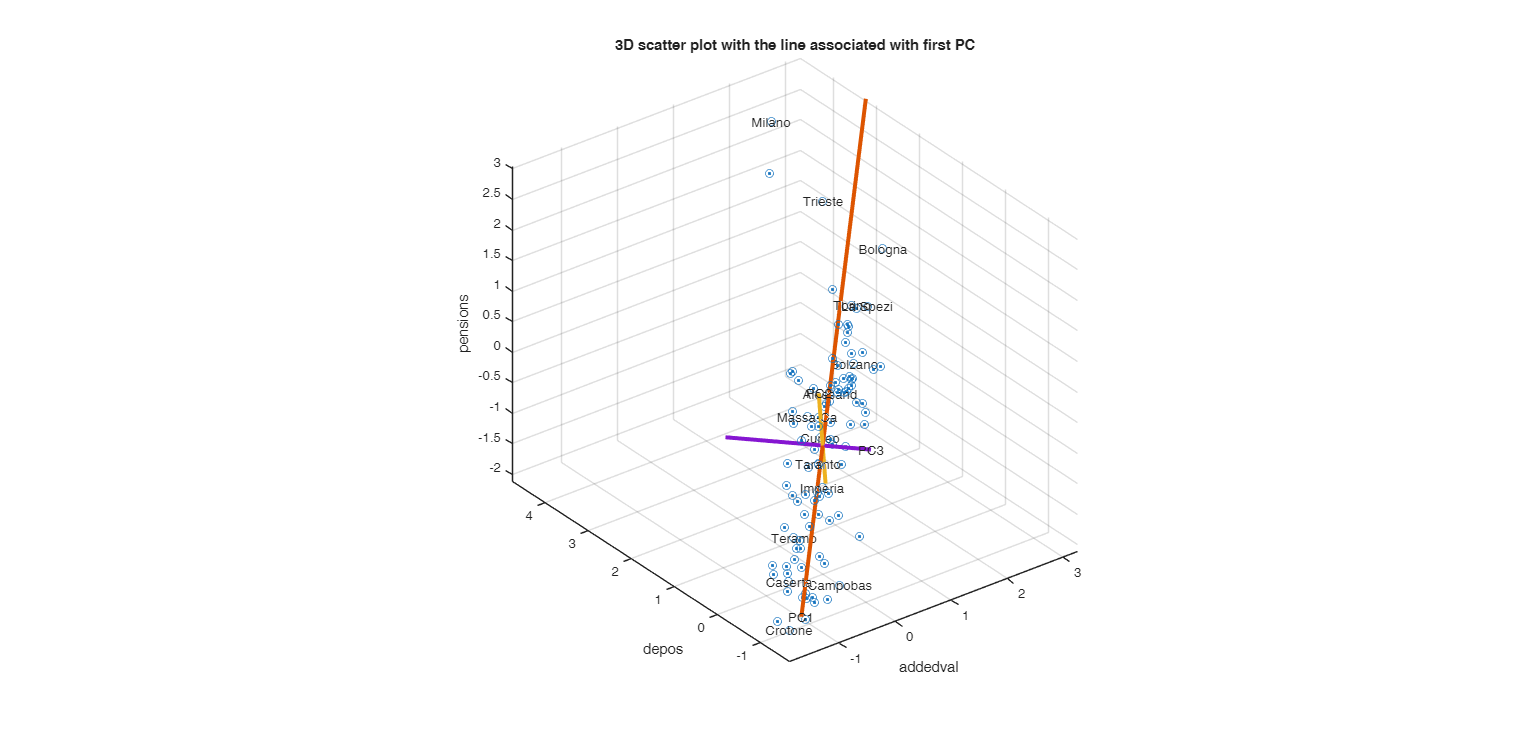
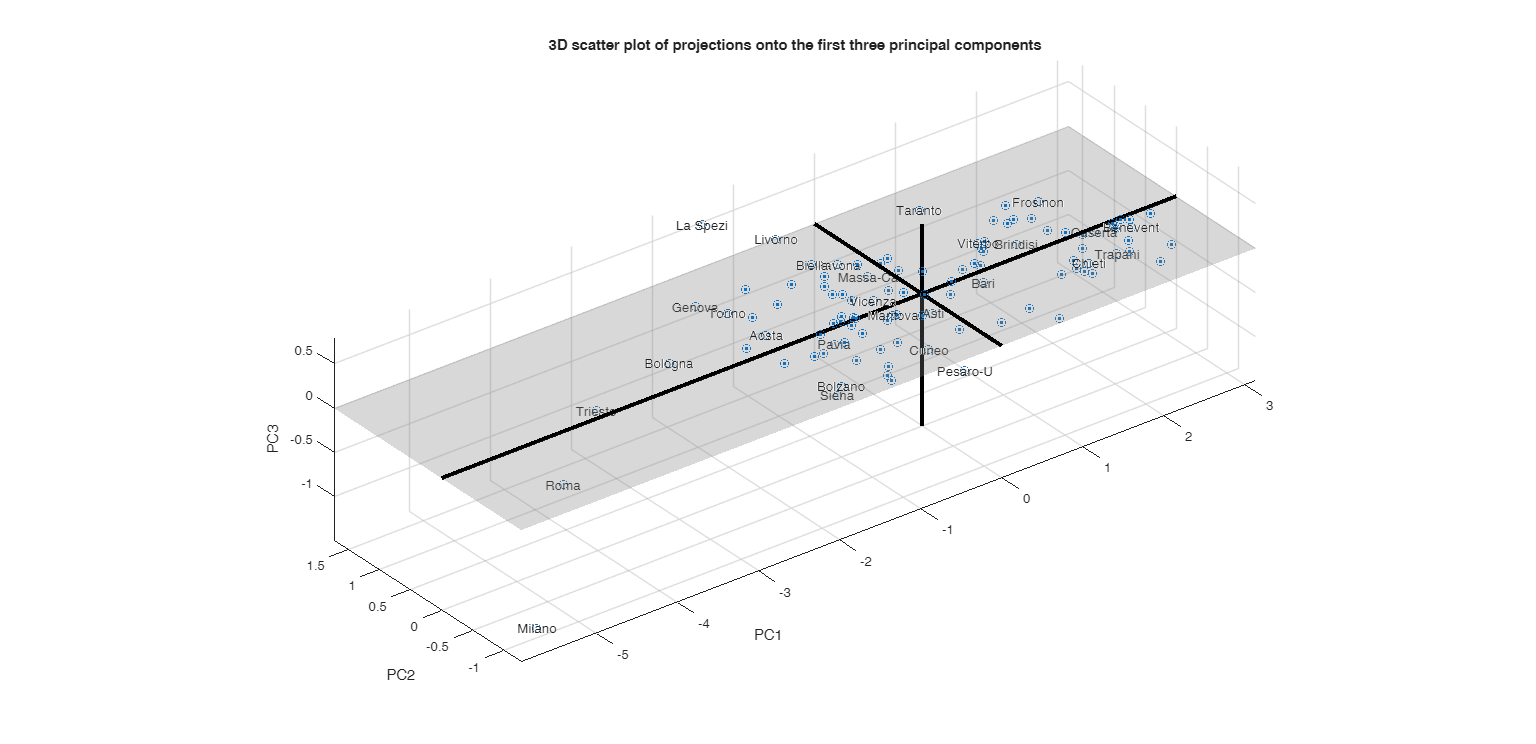
Boolean vector which
specifies whether to show or hide the PC axis in the original
or transformed space. For example if AddAxes [true false false]
just the first principal axis is shown. The default of
addAxes is true(3,1) that is all the 3 axes are shown.
Example: 'AddAxes',[false false true]
Data Types: logical
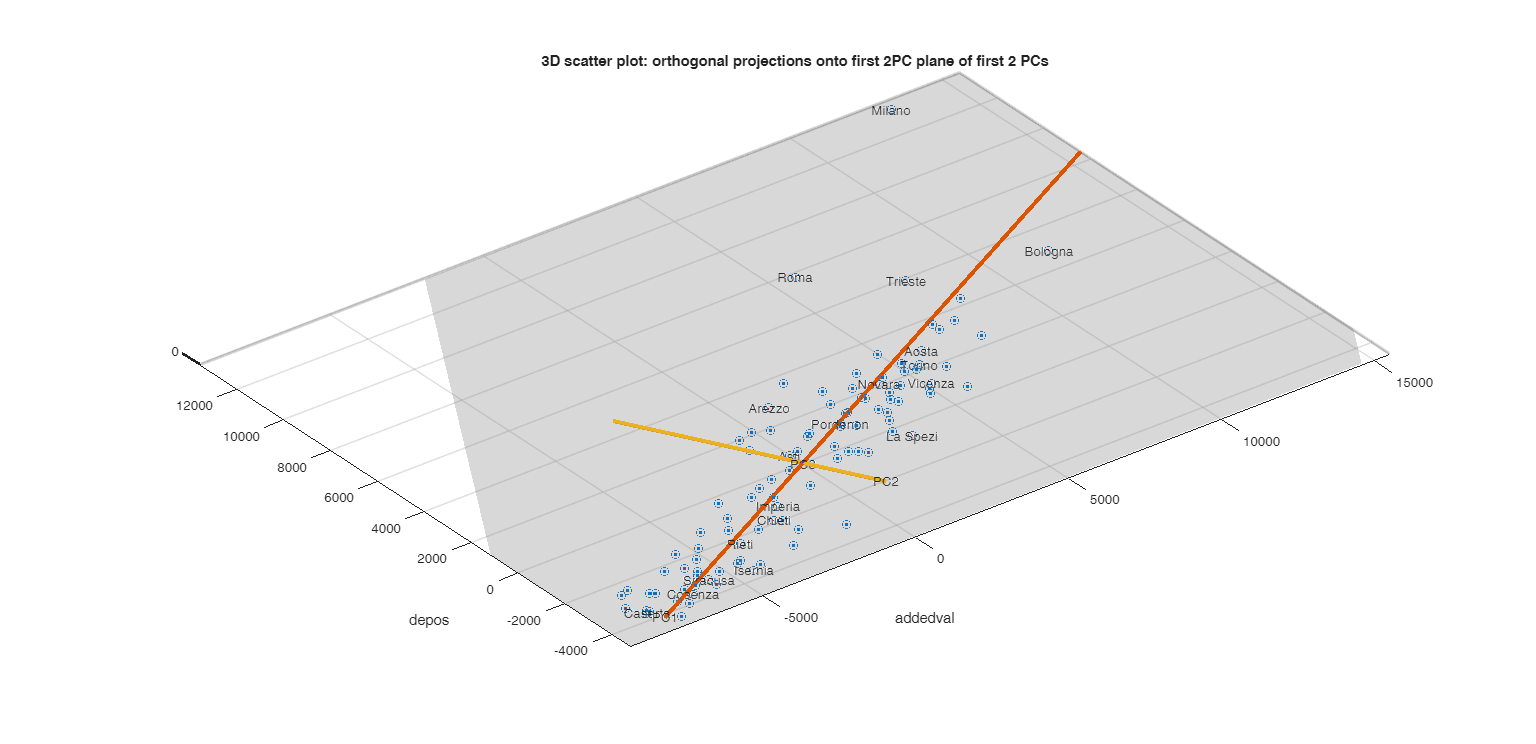
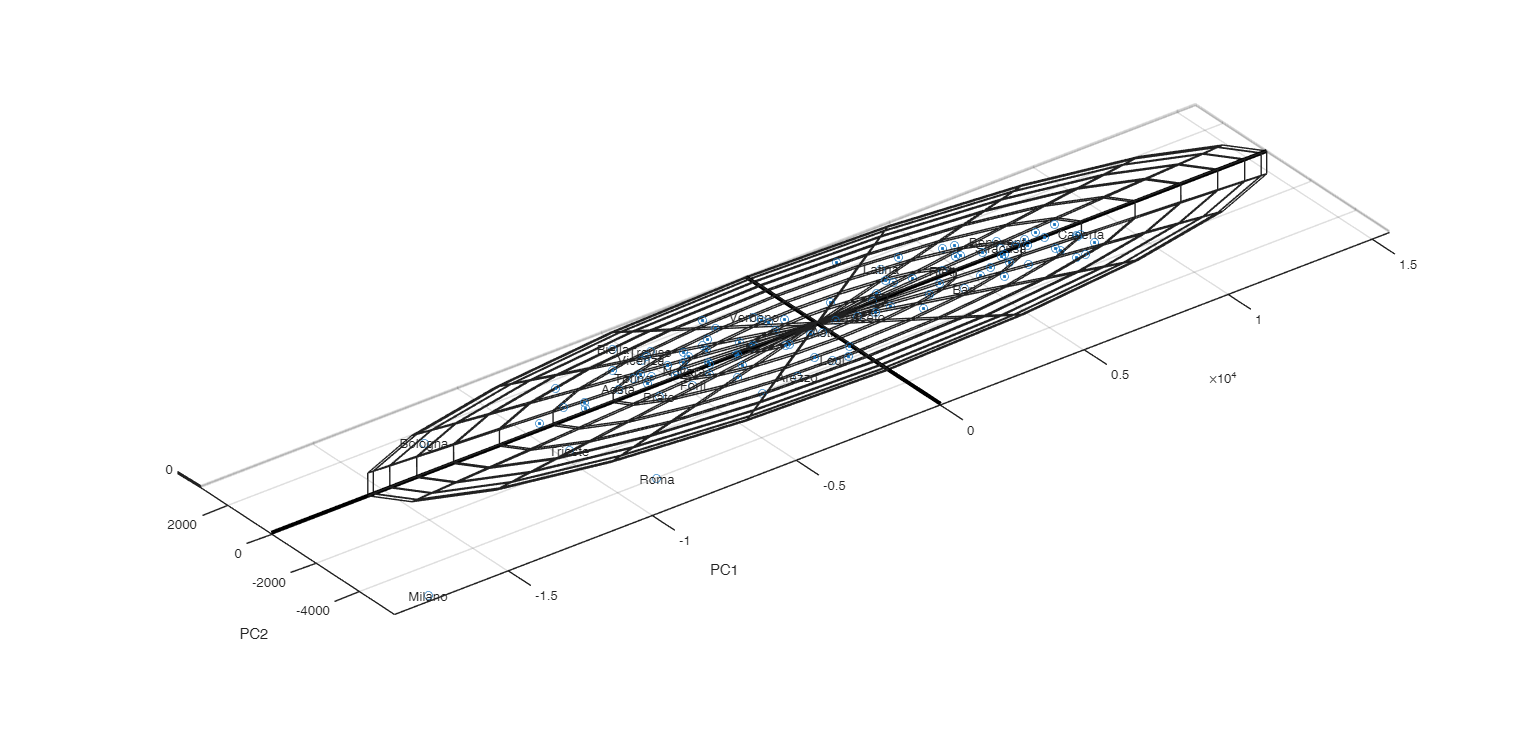
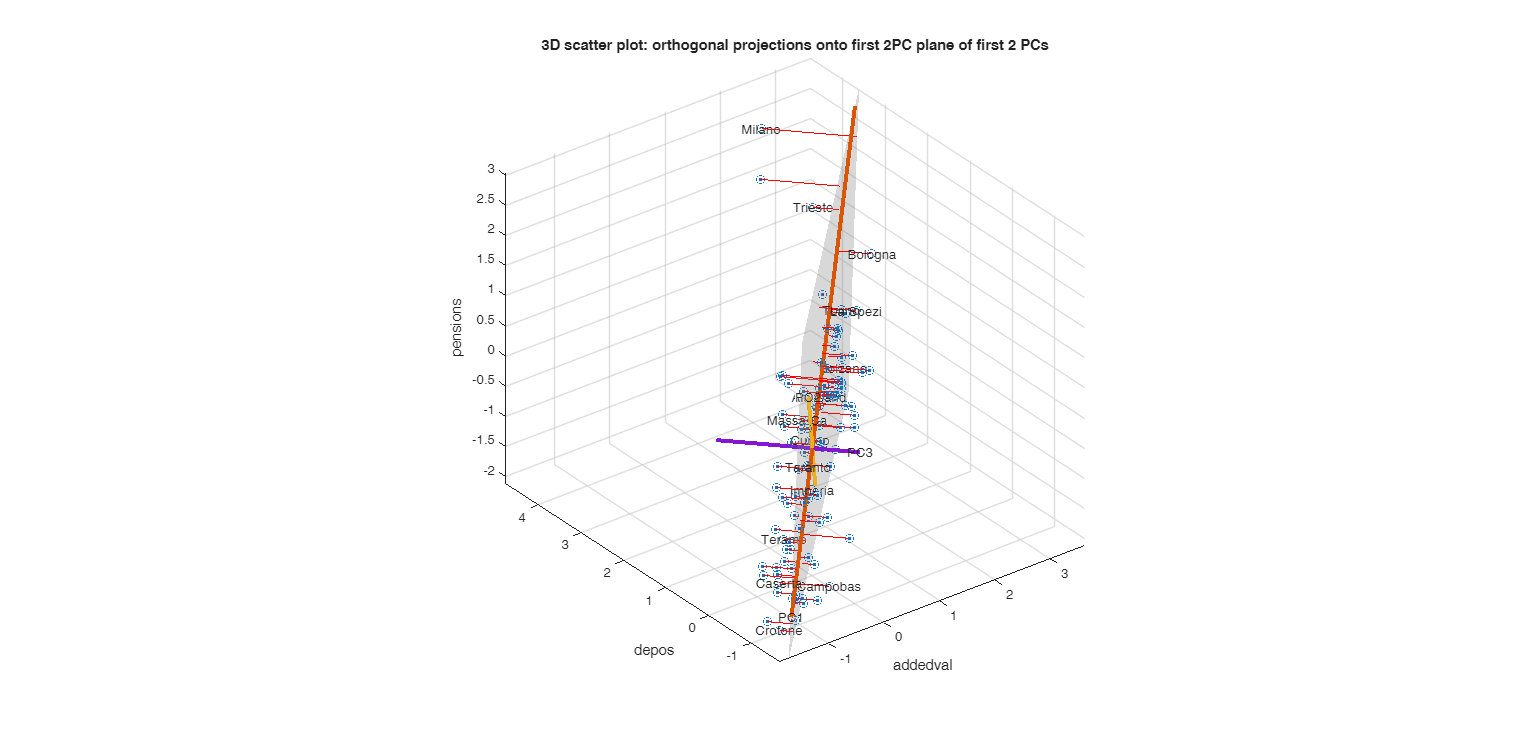
If this option is true (default) the constant plane
spanned by the first two PCs is shown on the screen in the plot of
projected points in the space of the first two PCs.
Example: 'AddConstantPlane',false
Data Types: logical
Width of the lines associated with the PC axis (when
they are visible). The default value of LineWidthAxes
is 3.
Example: 'LineWidthAxes',1
Data Types: single, double
Boolean which specifies
whether to standardize the variables, that is we operate on
the correlation matrix (default) or simply remove column
means (in this last case we operate on the covariance
matrix).
Example: 'standardize',false
Data Types: boolean
Percentage of text data
to show, specified as a scalar from 0 through 100.
To show all text, set TextDensityPercentage to
100. To show no text, set TextDensityPercentage to
0. The default value of TextDensityPercentage is
60. Note that Text Analytic toolbox is required
Example: 'TextDensityPercentage',80
Data Types: single or double
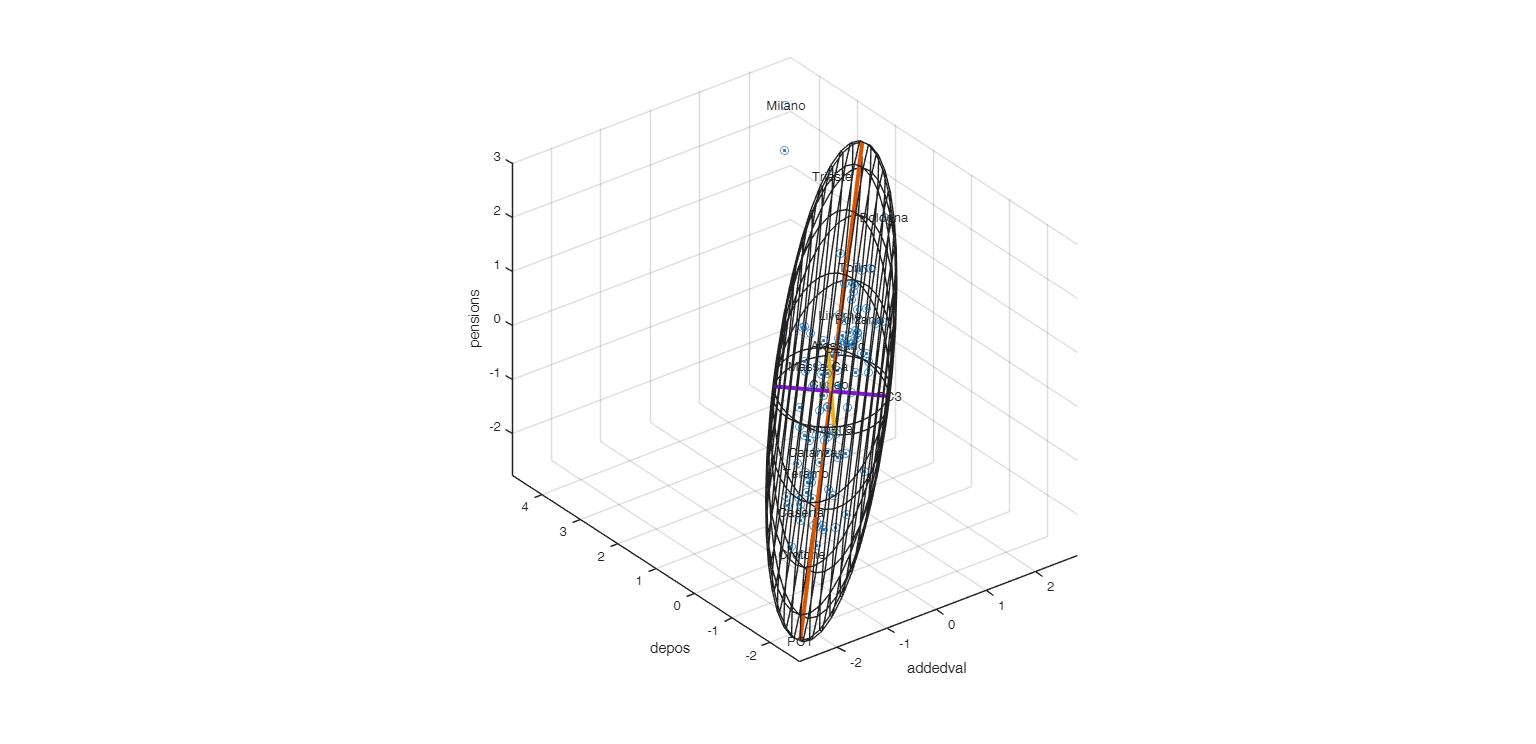
 Call to pcaProjection with option standardize.