n x p data matrix; n observations and p variables. Rows of
Y represent observations, and columns represent variables.
Rows of TBL represent observations, and columns
represent variables.
Data Types: single|double
Specify optional comma-separated pairs of Name,Value arguments.
Name is the argument name and Value
is the corresponding value. Name must appear
inside single quotes (' ').
You can specify several name and value pair arguments in any order as
Name1,Value1,...,NameN,ValueN.
Example:
 'DataVars',[2 4]
, 'groupvars',2
, 'nbins',10
For examples if 'DataVars' is [3 5], polar
histogram is done for variables 3 and 5. If 'DataVars' is
["Name1" "Name4"] variable with these names inside the
input table are used
Example: 'DataVars',[2 4]
Data Types: character vector | string array | cell array of character vectors | vector of positive integers | logical vector
If groupvars is [] then the output refers to the overall
sample. It can be vector of length n or a string (char) or
a number identifying a particular column in the input table
Y.
Example: 'groupvars',2
Data Types: character vector | string array | cell array of character vectors | vector of positive integers | logical vector | []
If nbins is a scalar, then we assume that it is referred
to the number of bins. Alternatively if nbins is a numeric
vector of length>1, we assume that nbins(1) is the leading
edge of the first bin, and nbins(end) is the trailing edge
of the last bin elements. The elements of input vector y
are binned into nbins equally spaced containers if nbins
is a scalar or into length(nbins)-1 containers if nbins is
not a scalar.
Remark: note that it is possible to pass all the options
which are allowed inside polarhistogram. See the examples
below for further details.
Example: 'nbins',10
Data Types: numeric vector
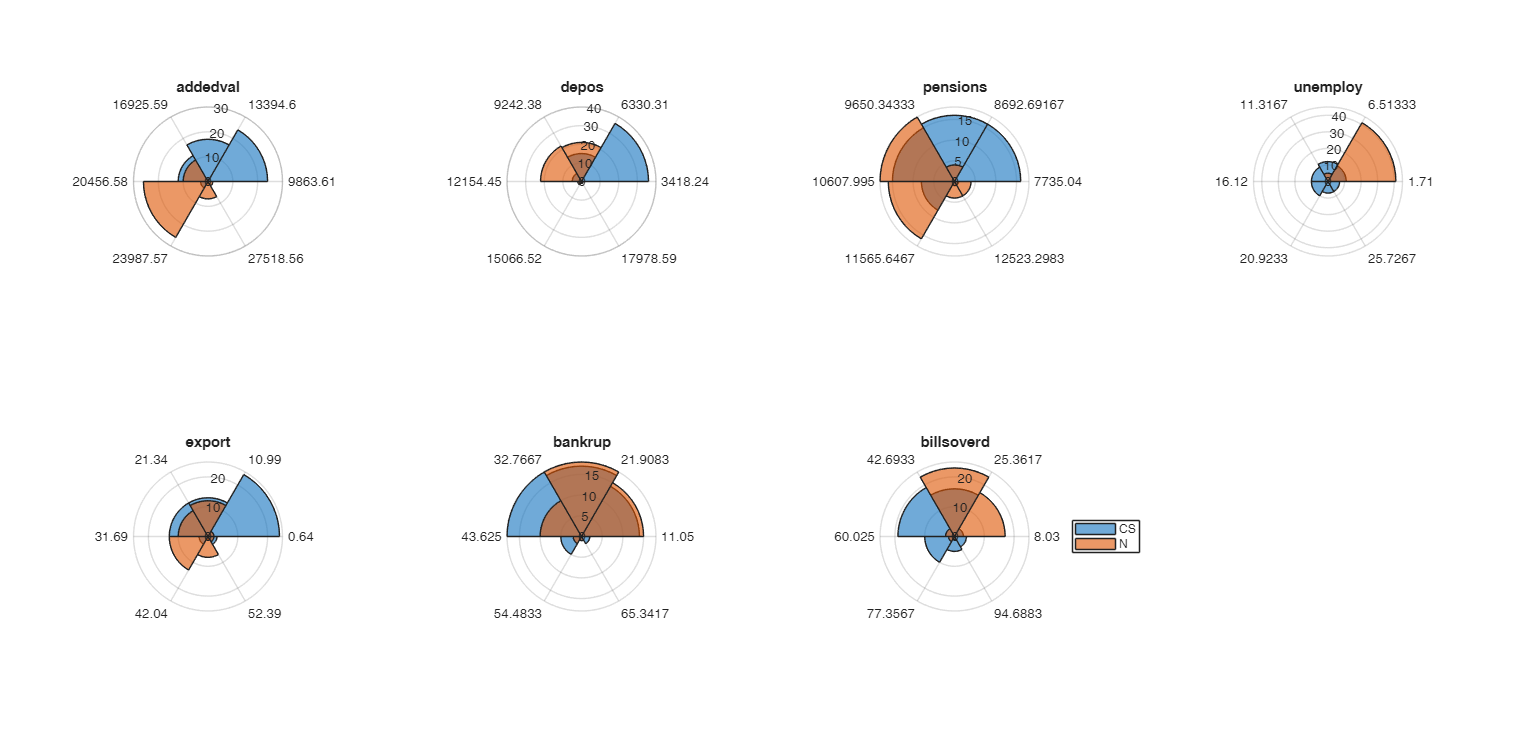
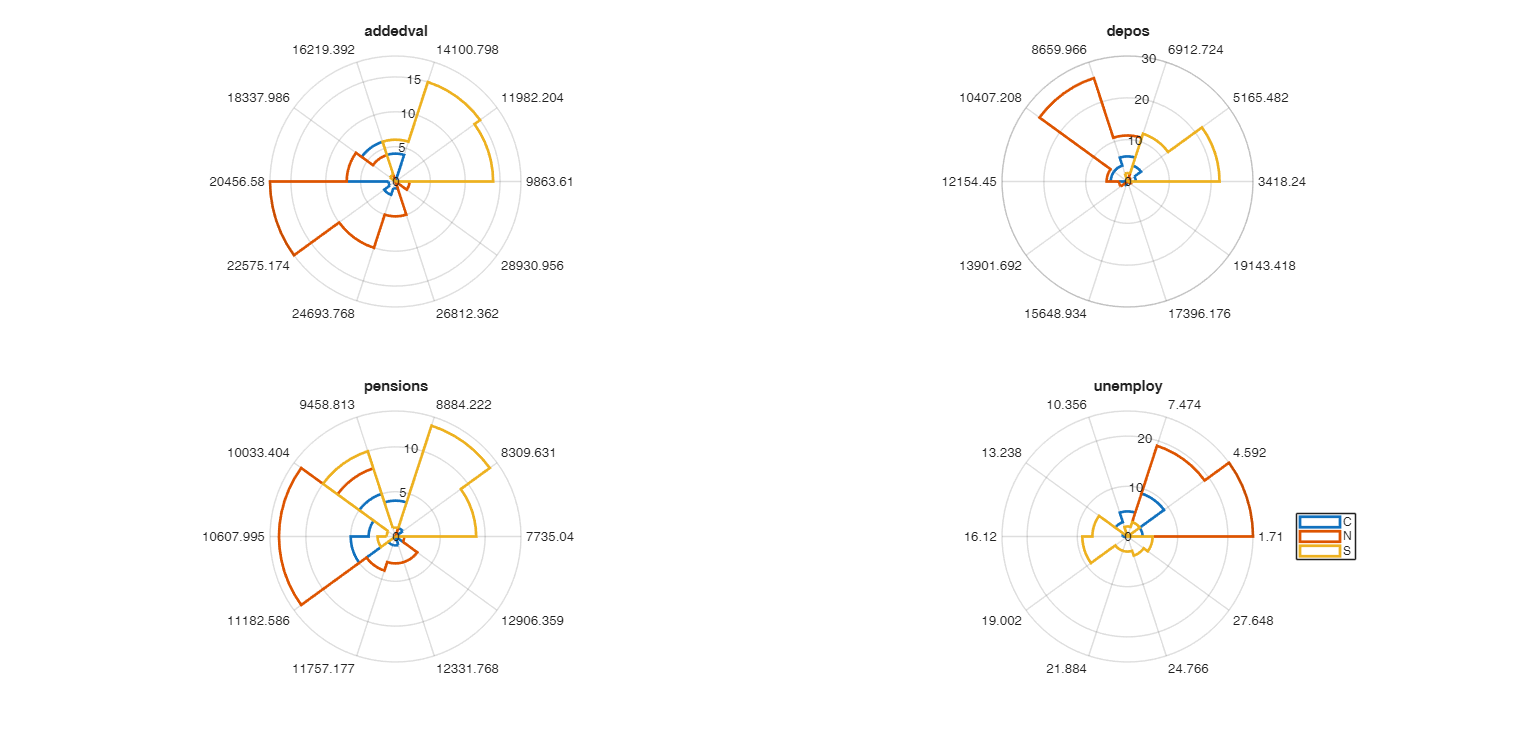
 Call with grouping variable.