GUImad
GUImad shows the necessary calculations to obtain MAD, S_M or S_Me in a GUI.
Syntax
Description
This routine shows all the intermediate necessary steps to compute the three following variability indexes: S_{M} = \frac{\sum_{i=1}^{r}|x_{i}-M| n_i}{n} S_{Me} = \frac{\sum_{i=1}^r |x_i-Me|n_i}{n}.
Examples
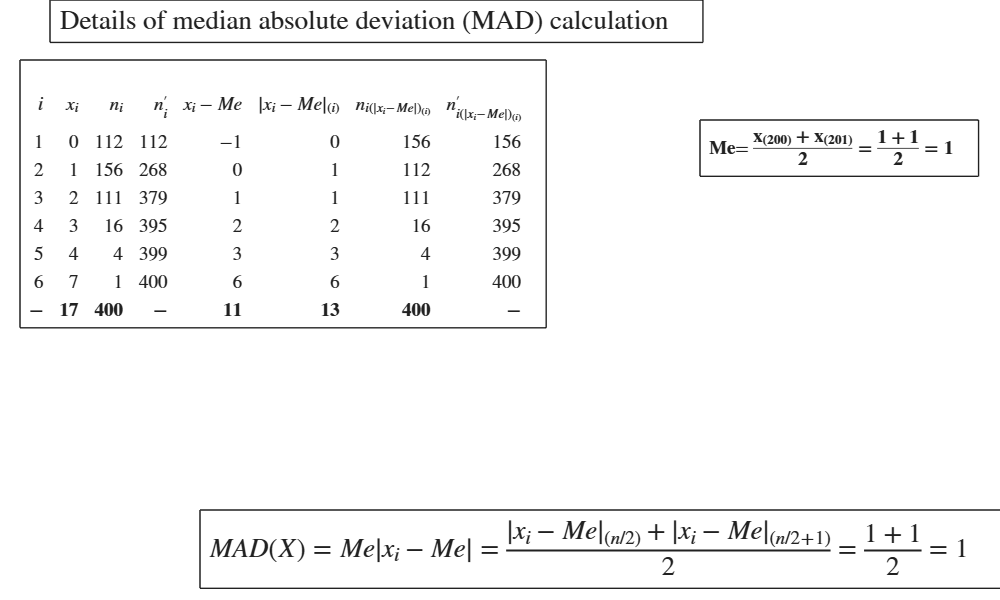
 MAD in a frequency distribution (discrete data).
MAD in a frequency distribution (discrete data).MAD = median absolute deviation from median.
% Frequency distribution of the number of children in a sample of 400
% families. (See page 29 of [CMR]).
X=[0  112
1  156
2  111
3  16
4  4
7  1];
x=X(:,1);
freq=X(:,2);
flag=1;
GUImad(x,flag,freq);
Related Examples
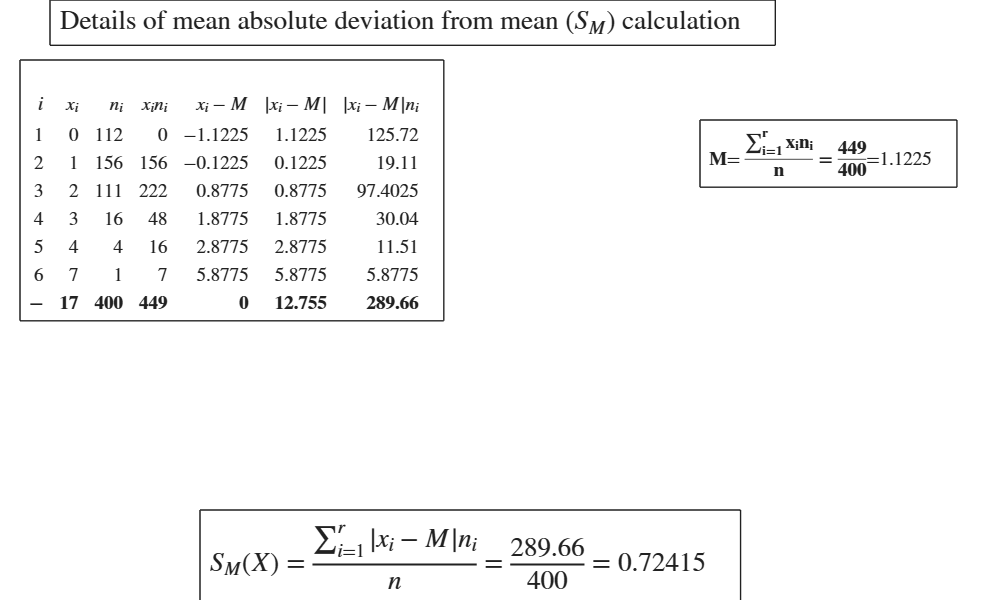
SM in a frequency distribution (discrete data).
SM in a frequency distribution (discrete data).SM= mean absolute deviation from mean.
% Frequency distribution of the number of children in a sample of 400
% families. (See page 29 of [CMR]).
X=[0  112
1  156
2  111
3  16
4  4
7  1];
x=X(:,1);
freq=X(:,2);
flag=0;
GUImad(x,flag,freq);
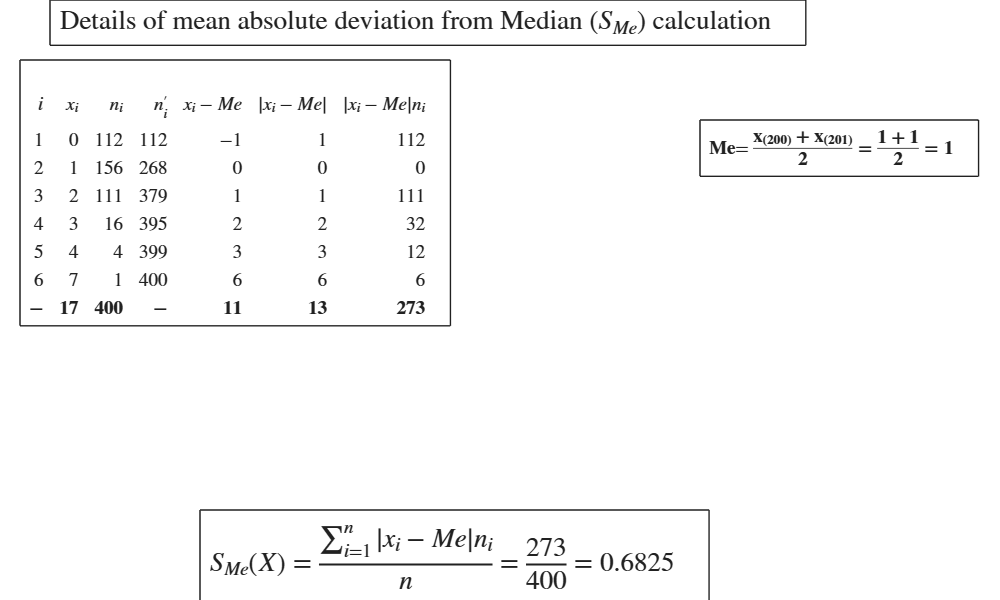
SMe in a frequency distribution (discrete data).
SMe in a frequency distribution (discrete data).SMe= mean absolute deviation from the median Frequency distribution of the number of children in a sample of 400 families. (See page 29 of [CMR]).
X=[0  112
1  156
2  111
3  16
4  4
7  1];
x=X(:,1);
freq=X(:,2);
flag=2;
GUImad(x,flag,freq);
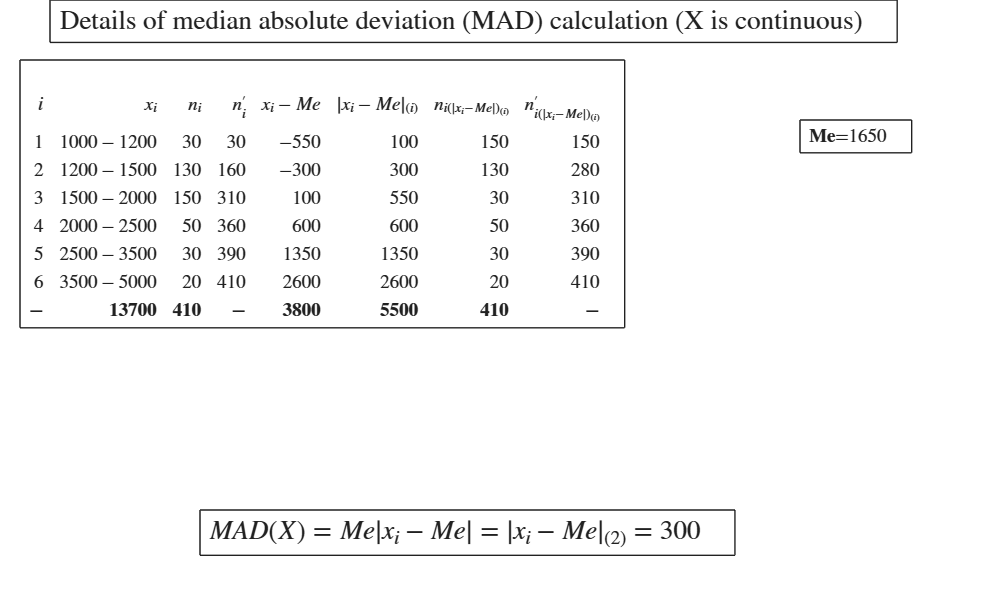
MAD in a frequency distribution (continuous data).
MAD in a frequency distribution (continuous data).Conside the following distribution of employees of a large company according to monthly gross wages: retr= classes of retribution (Euros)
retr=[1000 1200; 1200 1500; 1500 2000; 2000 2500; 2500 3500; 3500 5000];
% freq= frequencies
freq=[30; 130; 150; 50; 30; 20];
% x = vector which contains the extremes of the classes
x=[retr(1,1);retr(:,2)];
flag=1;
% GUImad is called with input option 'DiscreteData',false
GUImad(x,flag,freq,'DiscreteData',false);
Input Arguments
Output Arguments
References
Cerioli, A., Milioli, M.A., Riani, M. (2016), "Esercizi di statistica (Quinta edizione)". [CMR]
See Also
GUIstd
|
GUIvar
|
GUItrimmean