mdpattern
mdpattern finds and plots missing data patterns
Syntax
Description
Example of the use of options dispresults and plots.Mispat
=mdpattern(Y,
Name, Value)
[
Example of mdpattern with timetable input.Mispat,
tMisAndOut]
=mdpattern(___)
Examples
 mdpattern with table input.
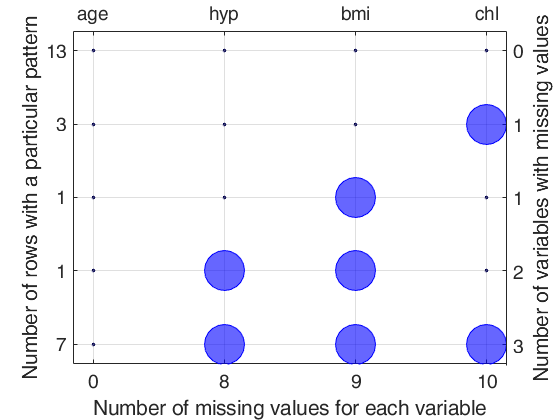
mdpattern with table input.Load the nhanes data The nhanes data is a dataset with 25 observations on the following 4 variables.
% age, Age group (1=20-39, 2=40-59, 3=60+).
% bmi, Body mass index (kg/m**2).
% hyp, Hypertensive (1=no,2=yes).
% chl, Total serum cholesterol (mg/dL).
% namvar array of strings containing the names of the columns of X.
namvar=["age"  "bmi" "hyp" "chl"];
X=[1   NaN  NaN  NaN
2 22.7   1 187
1   NaN   1 187
3   NaN  NaN  NaN
1 20.4   1 113
3   NaN  NaN 184
1 22.5   1 118
1 30.1   1 187
2 22.0   1 238
2   NaN  NaN  NaN
1   NaN  NaN  NaN
2   NaN  NaN  NaN
3 21.7   1 206
2 28.7   2 204
1 29.6   1  NaN
1   NaN  NaN  NaN
3 27.2   2 284
2 26.3   2 199
1 35.3   1 218
3 25.5   2  NaN
1   NaN  NaN  NaN
1 33.2   1 229
1 27.5   1 131
3 24.9   1  NaN
2 27.4   1 186];
Xtable=array2table(X,VariableNames=namvar);
[Mispat,tMisAndOut]=mdpattern(Xtable);
Detailed explanation of the "Missing data pattern figure"
Top axis contains the names of the variables.
Big circle means missing value; smaller filled dot represents non-missing value.
Left axis shows the number of observations for each pattern.
The sum of the numbers on the left axis is n, the total number of rows.
Right axis counts the variables with missing values.
The number of missing values for each variable is shown on the bottom axis.
Example of the use of options dispresults and plots.
Example of the use of options dispresults and plots.Load the nhanes data The nhanes data is a dataset with 25 observations on the following 4 variables.
% age, Age group (1=20-39, 2=40-59, 3=60+).
% bmi, Body mass index (kg/m**2).
% hyp, Hypertensive (1=no,2=yes).
% chl, Total serum cholesterol (mg/dL).
% namvar array of strings containing the names of the columns of X.
namvar=["age"  "bmi" "hyp" "chl"];
X=[1   NaN  NaN  NaN
2 22.7   1 187
1   NaN   1 187
3   NaN  NaN  NaN
1 20.4   1 113
3   NaN  NaN 184
1 22.5   1 118
1 30.1   1 187
2 22.0   1 238
2   NaN  NaN  NaN
1   NaN  NaN  NaN
2   NaN  NaN  NaN
3 21.7   1 206
2 28.7   2 204
1 29.6   1  NaN
1   NaN  NaN  NaN
3 27.2   2 284
2 26.3   2 199
1 35.3   1 218
3 25.5   2  NaN
1   NaN  NaN  NaN
1 33.2   1 229
1 27.5   1 131
3 24.9   1  NaN
2 27.4   1 186];
Xtable=array2table(X,VariableNames=namvar);
% Plot is not shown.
plots=false;
% option dispresults shows a detailed explanation of
% the content of two output matrices in the command window.
dispresults=true;
[Mispat,tMisAndOut]=mdpattern(Xtable,'plots',false,'dispresults',dispresults);
Table which shows missing values patterns
                   NrowsWithPattern    age     hyp     bmi      chl     NvarWithMis
                   ________________    ____    ____    ____    _____    ___________

    Pattern1            13.00          1.00    1.00    1.00     1.00        0.00
    Pattern2             3.00          1.00    1.00    1.00     0.00        1.00
    Pattern3             1.00          1.00    1.00    0.00     1.00        1.00
    Pattern4             1.00          1.00    0.00    0.00     1.00        2.00
    Pattern5             7.00          1.00    0.00    0.00     0.00        3.00
    totPatOrMis         25.00          0.00    8.00    9.00    10.00       27.00

0 means missing value and 1 represents non missing value
First column contains the number of observations for each pattern
For example number 13 shows that the associated pattern is repeated 13 times
The sum of the numbers in the first column is n, that is the total number of rows
The last column shows the number of variables with missing values for that particular pattern
------------------------
Missing value and outlier report
            Mean     Median    Stdev     MAD     Count_miss    Perc_miss    outInf    outSup
           ______    ______    _____    _____    __________    _________    ______    ______

    age      1.76      2.00     0.83     1.48       0.00          0.00       0.00      0.00
    bmi     26.56     26.75     4.22     4.60       9.00         36.00       0.00      0.00
    hyp      1.24      1.00     0.44     0.00       8.00         32.00       0.00      4.00
    chl    191.40    187.00    45.22    28.17      10.00         40.00       3.00      1.00

Columns outInf and outSup contain the number of units which are
above x0.75+1.5*IQR or below x0.25-1.5*IQR, where IQR is the interquartile range
Related Examples
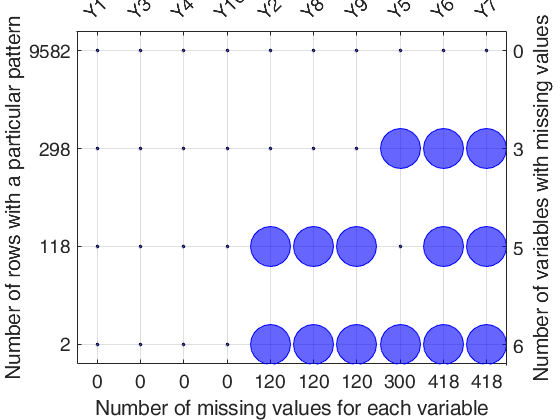
An example with 2 simulated patterns of missing values.
An example with 2 simulated patterns of missing values.
close all
n=10000;
p=10;
X=randn(n,p);
% Create first missing  data pattern
n1=300; n2=3;
rowsWithMis=randsample(n,n1);
colsWithMis=randsample(p,n2);
X(rowsWithMis,colsWithMis)=NaN;
% Create second missing  data pattern
n1=120; n2=5;
rowsWithMis=randsample(n,n1);
colsWithMis=randsample(p,n2);
X(rowsWithMis,colsWithMis)=NaN;
mdpattern(X);
Detailed explanation of the "Missing data pattern figure"
Top axis contains the names of the variables.
Big circle means missing value; smaller filled dot represents non-missing value.
Left axis shows the number of observations for each pattern.
The sum of the numbers on the left axis is n, the total number of rows.
Right axis counts the variables with missing values.
The number of missing values for each variable is shown on the bottom axis.
Personalized plots option: force heatmap.
Personalized plots option: force heatmap.Load the nhanes data The nhanes data is a dataset with 25 observations on the following 4 variables.
% age, Age group (1=20-39, 2=40-59, 3=60+).
% bmi, Body mass index (kg/m**2).
% hyp, Hypertensive (1=no,2=yes).
% chl, Total serum cholesterol (mg/dL).
% namvar array of strings containing the names of the columns of X.
namvar=["age"  "bmi" "hyp" "chl"];
X=[1   NaN  NaN  NaN
2 22.7   1 187
1   NaN   1 187
3   NaN  NaN  NaN
1 20.4   1 113
3   NaN  NaN 184
1 22.5   1 118
1 30.1   1 187
2 22.0   1 238
2   NaN  NaN  NaN
1   NaN  NaN  NaN
2   NaN  NaN  NaN
3 21.7   1 206
2 28.7   2 204
1 29.6   1  NaN
1   NaN  NaN  NaN
3 27.2   2 284
2 26.3   2 199
1 35.3   1 218
3 25.5   2  NaN
1   NaN  NaN  NaN
1 33.2   1 229
1 27.5   1 131
3 24.9   1  NaN
2 27.4   1 186];
Xtable=array2table(X,VariableNames=namvar);
plots = struct;
plots.heatmap = true;
mdpattern(Xtable,'plots',plots);
Detailed explanation of the "Missing data pattern figure"
Top axis contains the names of the variables.
In the heatmap, red cells mean missing values and blue cells mean non-missing values.
Left axis shows the number of observations for each pattern.
The sum of the numbers on the left axis is n, the total number of rows.
Right axis counts the variables with missing values.
The number of missing values for each variable is shown on the bottom axis.

Input Arguments
Output Arguments
References
Schafer, J.L. (1997). "Analysis of Incomplete Multivariate Data". London: Chapman & Hall.