GUIconcentration
GUIconcentration shows the necessary calculations to obtain the GINI concentration index in a GUI.
Description
Examples
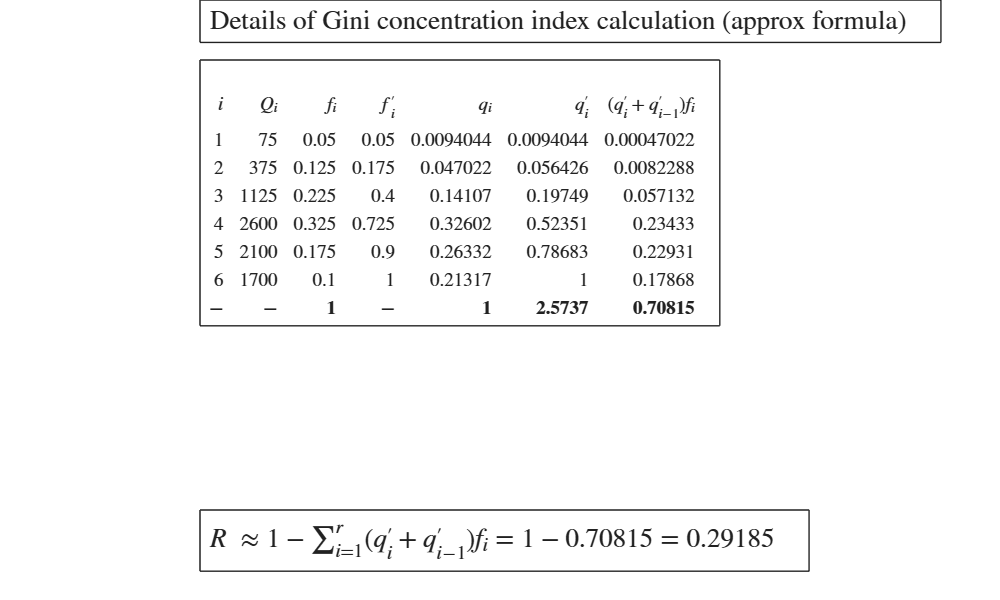
 Concentration index using approximate formula.
Concentration index using approximate formula.The families in a certain area have been classified according to their annual income.
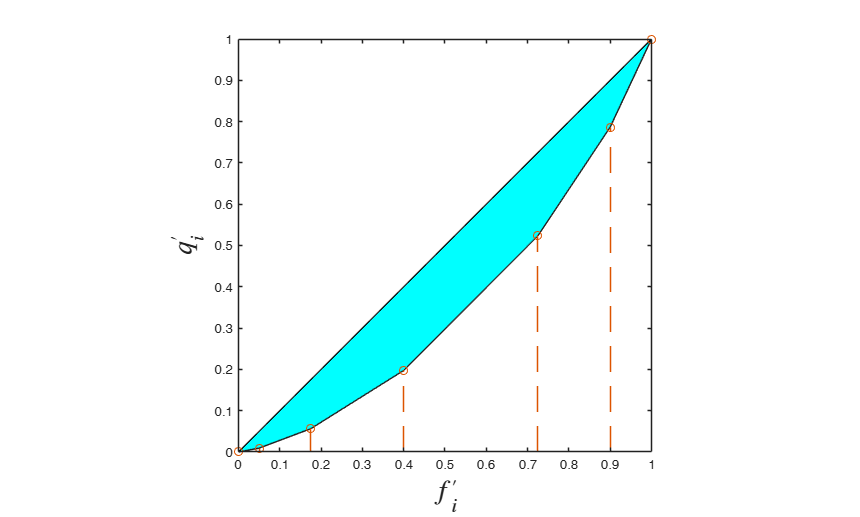
% This is exercise 1.28 from [CMR] - page 59.
% Classes of income and frequencies.
% 5  - 10	10
% 10 - 20	25
% 20 - 30	45
% 30 - 50	65
% 50 - 70	35
% 70 - 100	20
% Compute the concentration ratio and show the concentration area.
% Note that given that n is large we can use the approximate formula.
% Using as x_i the central value of the classes, we estimate the Q_i as
% x_i * n_i. For example Q_1 = 7.5 * 10, Q_2 = 15 * 25...Q_6 = 85 * 20
Q=[75 375 1125 2600 2100 1700];
ni=[10 25 45 65 35 20];
out=GUIconcentration(Q,'freq',ni,'plots',1);
Related Examples
Input Arguments
Output Arguments
References
Cerioli, A., Milioli, M.A., Riani, M. (2016), "Esercizi di statistica (Quinta edizione)". [CMR]