GUIcov
GUIcov shows the necessary calculations to obtain the covariance in a GUI.
Description
Examples
Related Examples
 Example 2 of weighted covariance.
Example 2 of weighted covariance.In this example first input argument is a table and only this argument is passed. (See Covariance from Wikipedia)
N=[0 0.4 0.1
0.3	 0	0.2];
colnames={'5' '6'	'7'};
rownames={'8','9'};
Ntable=array2table(N,'RowNames',rownames,'VariableNames',colnames);
out=GUIcov(Ntable);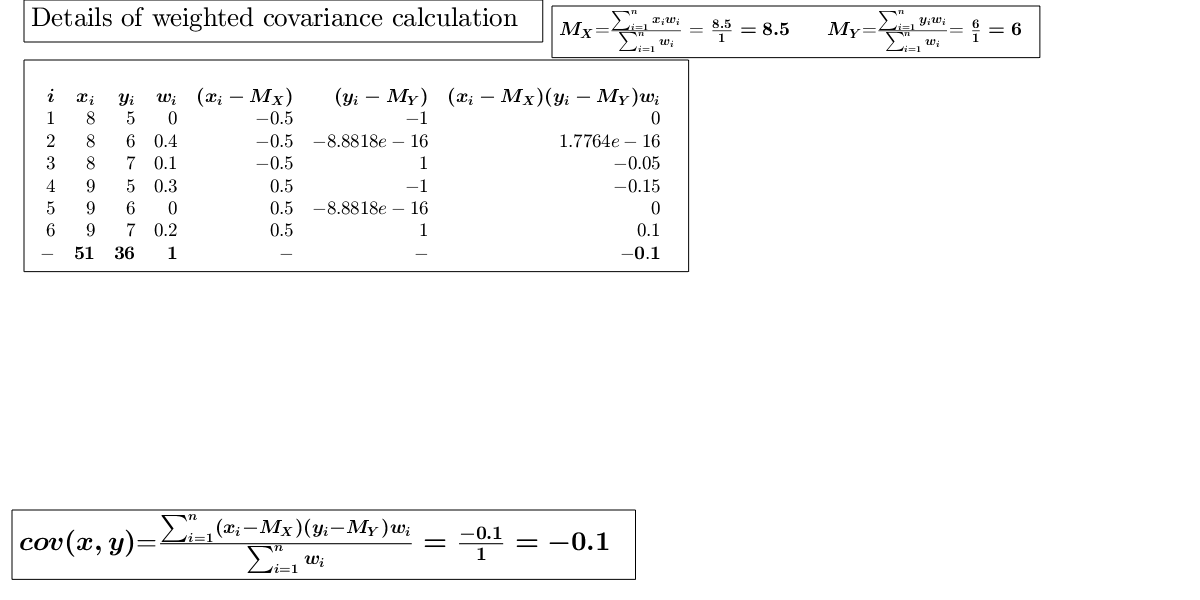
Input Arguments
Output Arguments
References
Milioli, M.A., Riani, M., Zani, S. (2019), "Introduzione all'analisi dei dati statistici (Quarta edizione ampliata)". [MRZ]
Cerioli, A., Milioli, M.A., Riani, M. (2016), "Esercizi di statistica (Quinta edizione)". [CMR]
See Also
GUIvar
|
GUImad
|
GUIskewness