GUItrimmean
GUItrimmean shows the necessary calculations to obtain the trimmed mean in a GUI.
Syntax
out=GUItrimmean(x,percent, freq)example
Description
Examples
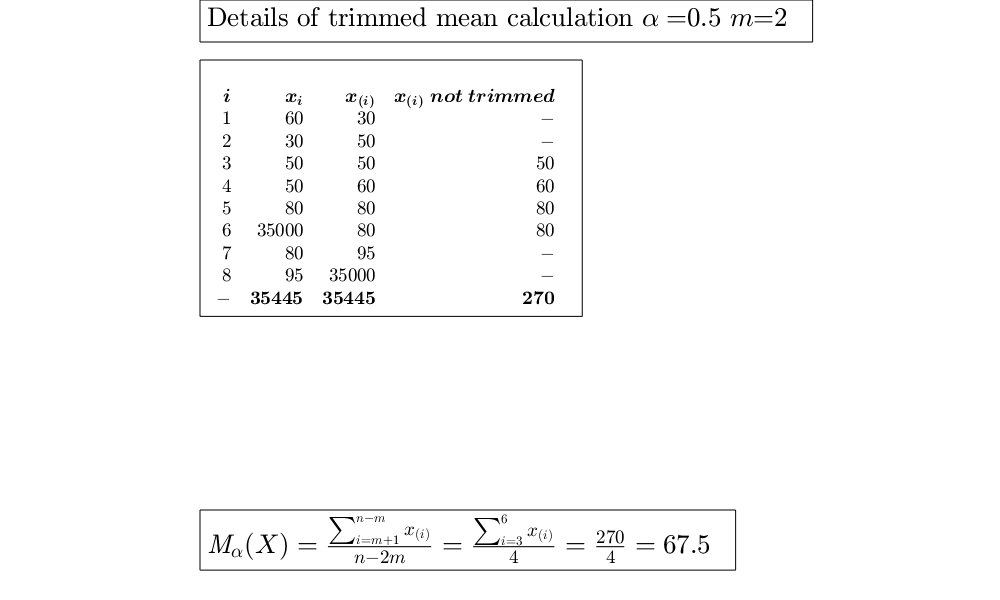
 Use of trimmed mean with 'percent' as per cent of trimming.
Use of trimmed mean with 'percent' as per cent of trimming.In this case we use 50% as per cent of trimming. (See page 92 of [MRZ])
x=[60 30 50 50  80 35000  80 95];
out=GUItrimmean(x,50);
Related Examples
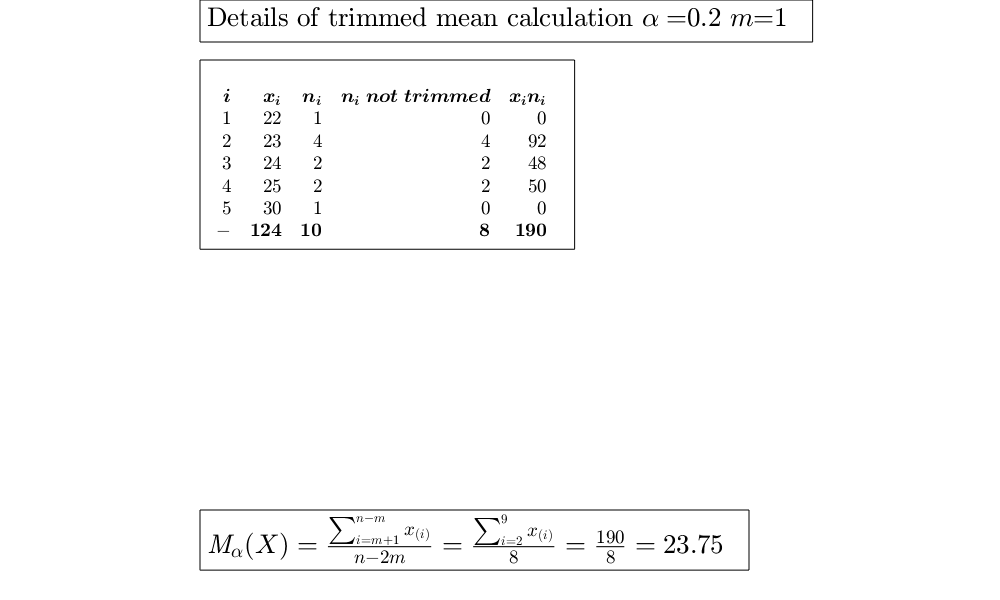
Trimmed mean in a frequency distribution.
Trimmed mean in a frequency distribution.Matrix X below contains the frequency distribution of the grades obtained by 10 students. (See page 71 of [CMR]) Compute the truncated mean of the grades using alpha=0.2
X=[22	1
25	2
30	1
23	4
24	2];
x=X(:,1);
freq=X(:,2);
GUItrimmean(x,20,freq)
ans =

  struct with fields:

           data: [6×5 table]
    trimmedmean: 23.75
Input Arguments
Output Arguments
References
Milioli, M.A., Riani, M., Zani, S. (2019), "Introduzione all'analisi dei dati statistici (Quarta edizione ampliata)". [MRZ]
Cerioli, A., Milioli, M.A., Riani, M. (2016), "Esercizi di statistica (Quinta edizione)". [CMR]