corrcdf
corrcdf computes correlation coefficient probability distribution function
Description
Examples
 An example where x, rho and n are all scalars.
An example where x, rho and n are all scalars.Find Pr(r<x|rho=0.1|n=12).
x=0;
rho=0.1;
n=12;
xs=num2str(x);
rhos=num2str(rho);
ns=num2str(n);
prob=corrcdf(x,rho,n);
disp(['Pr(r<' xs '|rho=' rhos, ', n=' ns ')'])
disp(prob);
Pr(r<0|rho=0.1, n=12)
    0.3727
x is not scalar.
x is not scalar.
x=-1:0.01:1;
rho=0;
n=12;
rhos=num2str(rho);
ns=num2str(n);
prob=corrcdf(x,rho,n);
% disp(['Pr(r<x|rho=' rhos, ', n=' ns ')'])
plot(x,prob)
xlabel("x")
ylabel(['Pr(r<x|rho=' rhos, ', n=' ns ')'])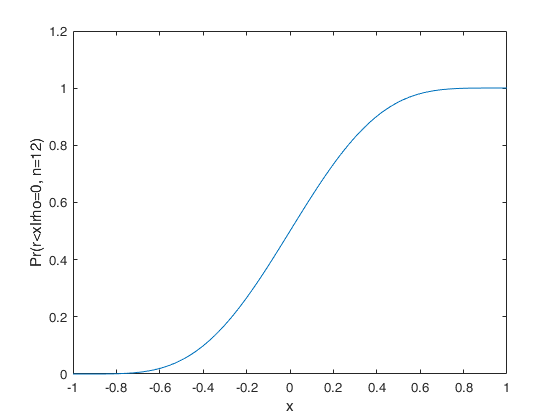
Related Examples
Check quality of the approximation when rho=0.
Check quality of the approximation when rho=0.Note that if rho=0 the test statistic sqrt(n-2)*r./sqrt(1-r.^2) is distributed as a Student T with (n-2) degrees of freedom
x=-0.9:0.01:0.9;
rho=0;
n=12;
rhos=num2str(rho);
ns=num2str(n);
prob=corrcdf(x,rho,n);
plot(x,prob)
xlabel("x")
ylabel(['Pr(r<x|rho=' rhos, ', n=' ns ')'])
hold('on')
testt=sqrt(n-2)*x./sqrt(1-x.^2);
probt=tcdf(testt,n-2);
plot(x,probt)
legend({'cdf using function corrcdf' 'cdf based on Student t'})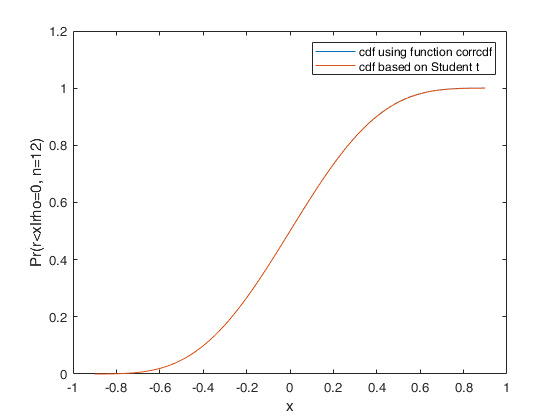
An example where rho is not scalar.
An example where rho is not scalar.
x=0.3;
rho=(0:0.1:0.8)';
n=12;
xs=string(x);
rhos=string(rho);
ns=string(n);
Prob=corrcdf(x,rho,n);
nameRows="Pr(r<"+xs+"|rho="+ rhos+ ", n="+ ns+ ")=";
nameRowsT=array2table(Prob,"RowNames",nameRows);
disp(nameRowsT)
                                  Prob
                                _________

    Pr(r<0.3|rho=0, n=12)=        0.82865
    Pr(r<0.3|rho=0.1, n=12)=      0.73514
    Pr(r<0.3|rho=0.2, n=12)=      0.61737
    Pr(r<0.3|rho=0.3, n=12)=       0.4813
    Pr(r<0.3|rho=0.4, n=12)=       0.3388
    Pr(r<0.3|rho=0.5, n=12)=      0.20646
    Pr(r<0.3|rho=0.6, n=12)=      0.10157
    Pr(r<0.3|rho=0.7, n=12)=     0.035409
    Pr(r<0.3|rho=0.8, n=12)=    0.0065293
An example where n is not scalar.
An example where n is not scalar.
x=0.3;
rho=0';
n=(5:5:50)';
xs=string(x);
rhos=string(rho);
ns=string(n);
Prob=corrcdf(x,rho,n);
nameRows="Pr(r<"+xs+"|rho="+ rhos+ ", n="+ ns+ ")=";
nameRowsT=array2table(Prob,"RowNames",nameRows);
disp(nameRowsT)
                               Prob
                              _______

    Pr(r<0.3|rho=0, n=5)=     0.68959
    Pr(r<0.3|rho=0, n=10)=    0.80065
    Pr(r<0.3|rho=0, n=15)=    0.86159
    Pr(r<0.3|rho=0, n=20)=    0.90077
    Pr(r<0.3|rho=0, n=25)=    0.92754
    Pr(r<0.3|rho=0, n=30)=    0.94645
    Pr(r<0.3|rho=0, n=35)=    0.96008
    Pr(r<0.3|rho=0, n=40)=    0.97004
    Pr(r<0.3|rho=0, n=45)=     0.9774
    Pr(r<0.3|rho=0, n=50)=    0.98288
Input Arguments
Output Arguments
References
Das Gupta, S. (1980). Distribution of the Correlation Coefficient, in: Fienberg, S.E., Hinkley, D.V. (eds) R.A. Fisher: An Appreciation, Lecture Notes in Statistics, vol 1. Springer, New York, NY.
Acknowledgements
For additional information see https://mathworld.wolfram.com/CorrelationCoefficientBivariateNormalDistribution.html This function follows the lines of MATLAB code developed by Xu Cui, and the file exchange submission Joshua Carmichael (2022), sample correlation distribution function https://www.mathworks.com/matlabcentral/fileexchange/45785-sample-correlation-distribution-function/