covplot
covplot plots the trajectories of the elements of the covariance (correlation) matrix monitored
Examples
 covplot with all default options.
covplot with all default options.generate input structure for malfwdplot
n=100;
p=4;
state1=141243498;
randn('state', state1);
Y=randn(n,p);
kk=[1:10];
Y(kk,:)=Y(kk,:)+4;
[fre]=unibiv(Y);
m0=20;
bs=fre(1:m0,1);
[out]=FSMeda(Y,bs,'init',30);
% Produce monitoring covariances plot with all the default options
covplot(out)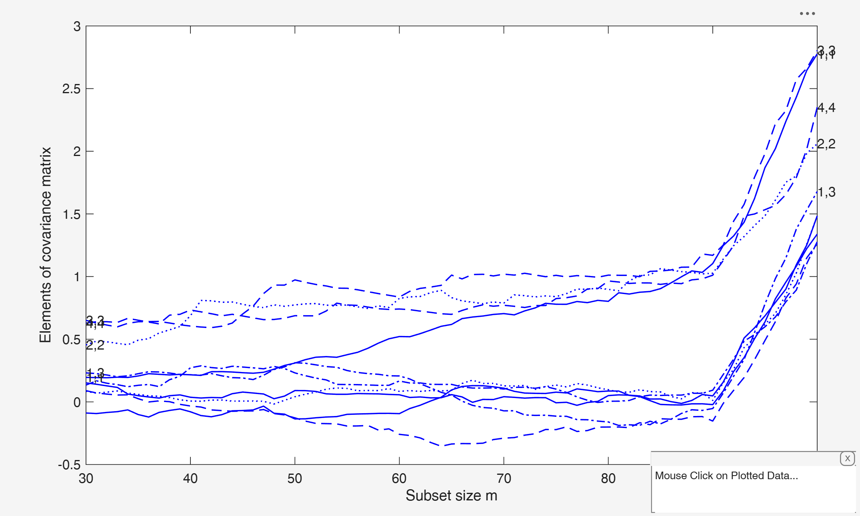
Related Examples
Example of the use of option tag.
Example of the use of option tag.
n=100;
p=4;
state1=141243498;
randn('state', state1);
Y=randn(n,p);
kk=[1:10];
Y(kk,:)=Y(kk,:)+4;
[fre]=unibiv(Y);
m0=20;
bs=fre(1:m0,1);
[out]=FSMeda(Y,bs,'init',30);
% Initialize structure fground
fground = struct;
% Specify the number of trajectories which have to be highlighted
fground.funit=2;
% Specify the steps in which labels have to be put
n=size(Y,1);
fground.flabstep=[n/2 n*0.75 n+0.5];
% Specify the line width of the highlighted trajectories
fground.LineWidth=3;
covplot(out,'fground',fground,'tag','pl_mycov')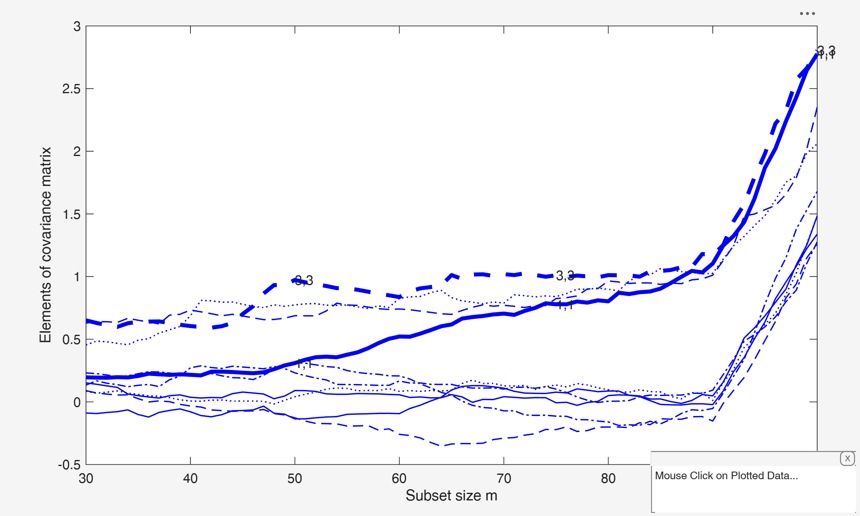
Input Arguments
Output Arguments
References
Atkinson, A.C., Riani, M. and Cerioli, A. (2004), "Exploring multivariate data with the forward search", Springer Verlag, New York.
See Also