lga

lga performs linear grouping analysis

Syntax

Description

example

out =lga(X, k) lga with all default options.

example

out =lga(X, k, Name, Value) lga with niter = 1000 and biter = 3000.

Examples

expand all

  • lga with all default options.
  • rng('default')
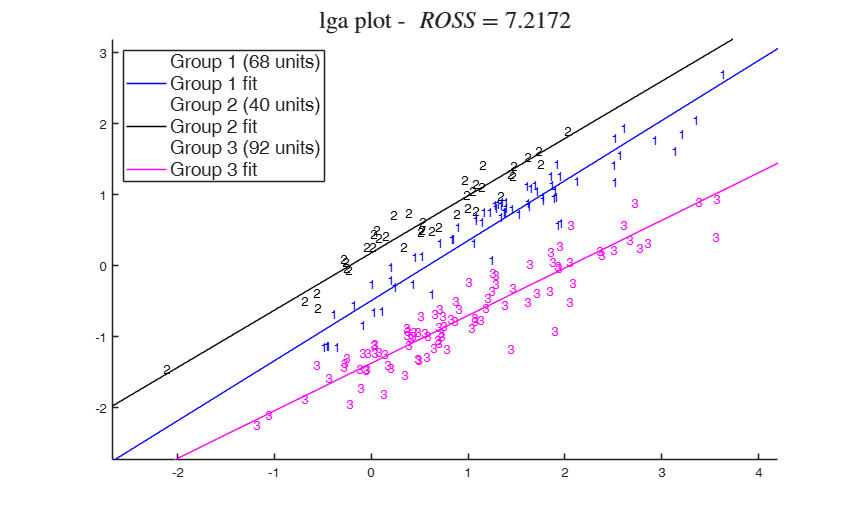
    rng(123); % this leads to ROSS = 7.2172;
    X=load('X.txt');
    out=lga(X,3);
    LGA Algorithm k =3 biter =23 niter =10
    Finished.
    
    Click here for the graphical output of this example (link to Ro.S.A. website).

  • lga with niter = 1000 and biter = 3000.
  • X=load('X.txt');
    out=lga(X,4,'niter',1000,'biter',3000);

    Input Arguments

    expand all

    X — input data matrix. Matrix.

    Input data as matrix of size n-by-p

    Data Types: single| double

    k — number of clusters. Scalar.

    Scalar which specifies the number of clusters.

    Data Types: single| double

    Name-Value Pair Arguments

    Specify optional comma-separated pairs of Name,Value arguments. Name is the argument name and Value is the corresponding value. Name must appear inside single quotes (' '). You can specify several name and value pair arguments in any order as Name1,Value1,...,NameN,ValueN.

    Example: 'biter',1 , 'niter',1 , 'showall','true' , 'stand','true' , 'silent','true' , 'plots',1

    biter —Hyperplane number.integer.

    number of different starting hyperplanes to try.

    Example: 'biter',1

    Data Types: double

    niter —Number of iterations.positive integer.

    Number of iterations to attempt for convergence.

    Example: 'niter',1

    Data Types: double

    showall —Type of display.logical.

    If true then display all the outcomes, not just the best one.

    Example: 'showall','true'

    Data Types: char

    stand —Data standardization.logical.

    If true standardize the X matrix with the standard deviation before fitting.

    Example: 'stand','true'

    Data Types: char

    silent —Text ouptut.logical.

    If true, produces no text output during processing. The default value is false.

    Example: 'silent','true'

    Data Types: char

    plots —plot on the screen.scalar.

    If plots=1 a plot is showed on the screen with the final allocation (and if size(X,2)==2 with the lines associated to the groups).

    Example: 'plots',1

    Data Types: double

    Output Arguments

    expand all

    out — description Structure

    Structure which contains the following fields

    Value Description
    cluster

    vector containing the cluster memberships.

    ROSS

    the Residual Orthogonal Sum of Squares for the solution.

    converged

    logical. True if at least one solution has converged.

    nconverg

    the number of converged solutions (out of biter starts).

    X

    the (scaled if selected) dataset.

    hpcoeff

    best hyerplane

    scaled

    logical. Is the data scaled?

    k

    the number of clusters to be found.

    biter

    the biter setting used.

    niter

    the niter setting used.

    alpha

    level of trimming. Added for consistency with rlga. In this case out.alpha=0;

    class

    'lga'.

    References

    Van Aelst, S. and Wang, X. and Zamar, R. and Zhu, R. (2006), Linear Grouping Using Orthogonal Regression, "Computational Statistics and Data Analysis", Vol. 50, pp. 1287-1312.

    See Also

    This page has been automatically generated by our routine publishFS