Monitoring Minimum Deletion Residual Plot
For outlier detection it is useful to monitor the minimum deletion residual r*[m+1] among the units not belonging to the subset. If one or more atypical observations are present in the data, the plot of r*[m+1] against the subset size m will show a peak in the step prior to the inclusion of the first outlier.
Suppose you want to analyze the Hawkins data.
% Load Hawkins data: 128 observations and 9 explanatory variables
load hawkins;
% Define y
y=hawkins{:,9};
% Define design matrix X
X=hawkins{:,1:8};
% Initial starting point based on Least Trimmed Squares
[out]=LXS(y,X,'nsamp',10000);
% Exploratory Forward Search
[out]=FSReda(y,X,out.bs);
% Monitoring minimum deletion residuals plot
mdrplot(out,'ylimy',[1 8],'xlimx',[25 128])
The plot of minimum deletion residual among observations not in the subset, shows three clear peaks (see Figure below).
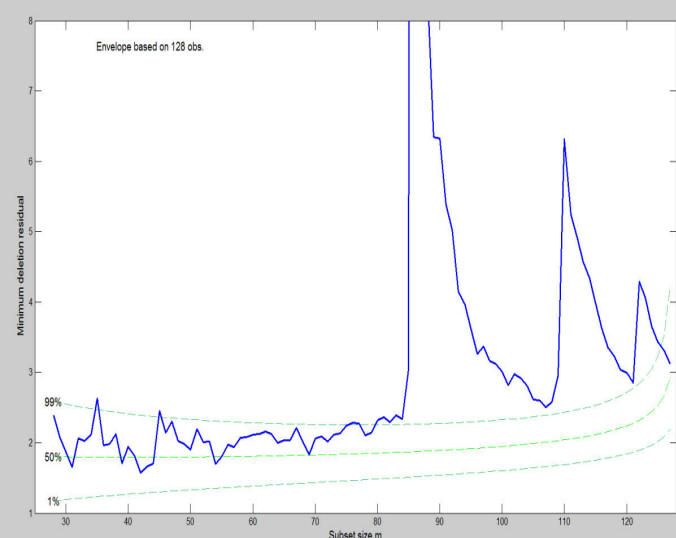
The three peaks in the figure show the distance of the nearest observation from the model that has been fitted so far. The first peak is the largest because the variance of the first 86 cases is so small. The declining shape of each peak is caused by the increase in s2 as outliers are introduced during the search, which reduces the size of the deletion residuals. At the end of the peaks there is nothing remarkable about the values of the deletion residuals. This plot is one way in which the forward search reveals the masked nature of the outliers. This plots, however, is static in the sense that does not enable for example to understand from which units the 3 peaks, which clearly appear in the minimum deletion residual plot, are formed. Similarly, it is not clear which trajectories of the residuals correspond to the three peaks. So far all this information had to be checked manually analyzing the units which entered the search. At present, thanks to the interactive connection which we have created among the different plots it is possible to select a part of the search in the monitoring of the minimum deletion residual using the option databrush and suboption persist and at the same time to see which are the corresponding residuals in the monitoring residuals plot and/or the position of the units highlighted in the scatter plot matrix.
We initially produce the monitoring residuals plot.
resfwdplot(out);
Finally we use the option databrush inside function mdrplot.
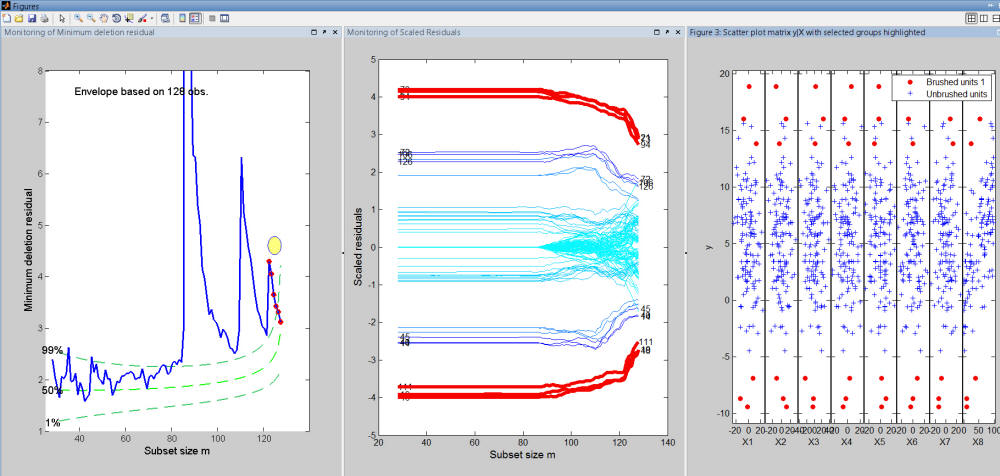
databrush=struct;
databrush.selectionmode='Brush'; % Brush selection
databrush.persist='on'; % Enable repeated mouse selections
databrush.Label='on'; % Write labels of selected steps while selecting
databrush.RemoveLabels='off'; % Do not remove labels after selecting
mdrplot(out,'ylimy',[1 8],'databrush',databrush);
For example, Figure below shows that the final part of the search which corresponds to the final peak is selected, it corresponds to the most 6 extreme (negative and positive) residuals enter the last 6 steps of the search. The plot of y against all explanatory variables shows that in the scatter of y against X8 these units are those which deviate most from the regression line.
Similarly, if we do a brushing of the steps of the search before the highest peak, we can see that all these steps correspond to the set of trajectories which have a residual very close to 0 in the initial part of the search and when the units forming the other groups are introduced their residual is completely mixed to that of the other units (see Figure below).
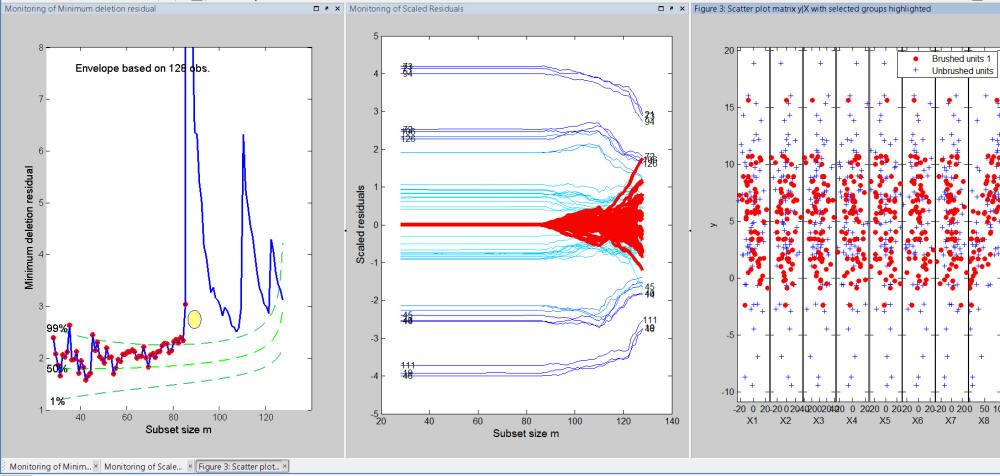
In conclusion: every time a brushing action is performed on the monitoring residuals plot, it is possible to display in an automatic way also the information about the position of the brushed units in the scatter diagram of y against the required explanatory variable(s) .
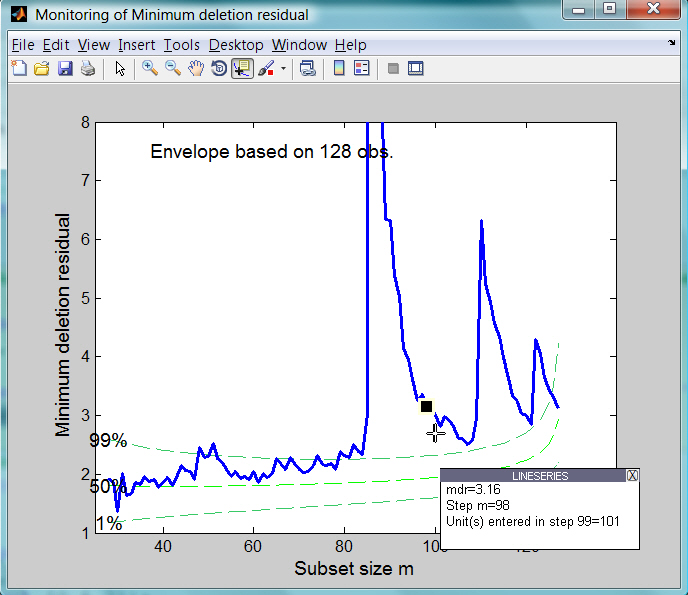
Using option datatooltip it is also possible to interact with the plot of minimum deletion residual. Clicking with the mouse on a point of the curve it is possible to have information about the unit selected, the step in which the unit entered the search and the associated label (if it is present).
For example, using the command
mdrplot(out,'ylimy',[1 8],'datatooltip',1);if we click on the curve at step m=98 it is possible to know that the value of minimum deletion residual is equal to 3.16 and that the unit which will join the subset at step m=99 will be the one at row 101.
| Functions |
• The developers of the toolbox• The forward search group • Terms of Use• Acknowledgments