Index Plot of Residuals
It is often useful to see the position of the outliers in the original yXplot matrix (plot of y against each column of X)
Suppose you want to analyze the Stack Loss data using LTS estimator and analyze the position of the residuals which are outside the confidence bands.
load('stack_loss.txt');
y=stack_loss(:,4);
X=stack_loss(:,1:3);
% LTS fit
[out]=LXS(y,X,'lms',0,'yxsave',1);
% Initialize databrush
databrush=struct;
databrush.bivarfit='2';
databrush.selectionmode='Rect'; % Brush selection
databrush.persist='on'; % Enable repeated mouse selections
databrush.Label='on'; % Write labels of trajectories while selecting
databrush.RemoveLabels='off'; % Do not remove labels after selection
% Brush the index plot of robust residuals
resindexplot(out,'databrush',databrush);
Here is what happens if we brush first the units whose residual
is positive and lies outside the confidence bands (units 1-4) and then the
unit which has a negative residual outside the confidence band (unit 21).
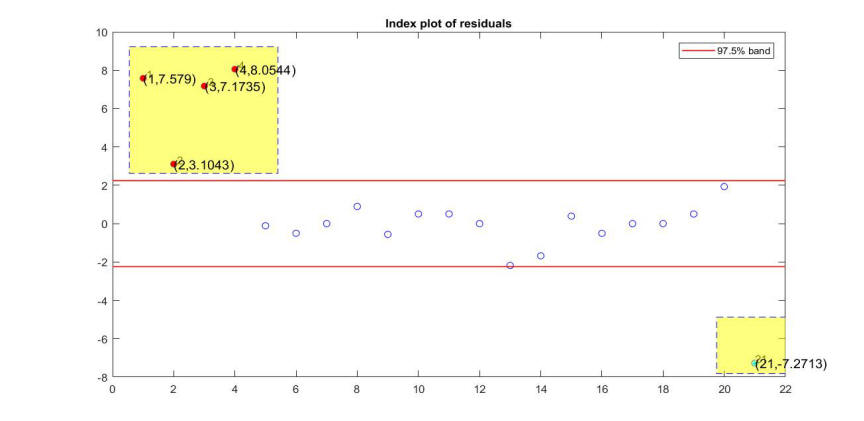
The plot of y against all explanatory variables shows that while units 1-4 could be seen by a careful examination of the yXplot, on the other hand, case 21 is a typical case of masking.

Here is the information after brushing with appears on the command window
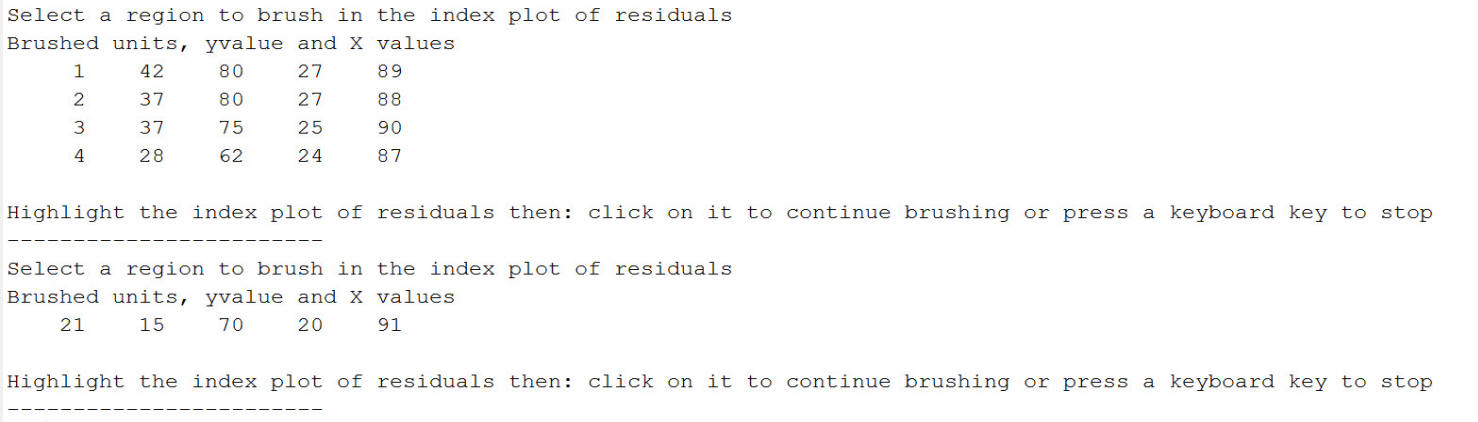
In conclusion: every time a brushing action is performed on the monitoring residuals plot, it is possible to display in an automatic way also the information about the position of the brushed units in the scatter diagram of y against the required explanatory variable(s).
| Functions |
• The developers of the toolbox• The forward search group • Terms of Use• Acknowledgments