getYahoo
getYahoo downloads financial time series from Yahoo Finance and optionally plots them using a customizable three-panel layout
Description
getTickers, getYahoo and getFundamentals can be used jointly to build a complete workflow: from the selection of representative market tickers, to the retrieval and dynamic interactive plot of their price time series, and finally to the extraction of their fundamental financial information.
For background on financial data and market analysis, see: Yahoo Finance API documentation https://finance.yahoo.com/
Two tickers, no plots.out
=getYahoo(ticker,
Name, Value)
Examples
Related Examples
 Multiple tickers.
Multiple tickers.ticker passed as a cell array of characters.
ticker={'G.MI','ENEL.MI','ISP.MI'};
out = getYahoo(ticker,'plots',false,'msg',false);
ticker Name
_______ __________________
"^IXIC" "Nasdaq Composite"
"AAPL" "Apple"
"MSFT" "Microsoft"
"NVDA" "NVIDIA"
"AMZN" "Amazon"
"GOOGL" "Alphabet Class A"
Requested pair range=1y, interval=1m is not supported.
Using interval=1d instead.
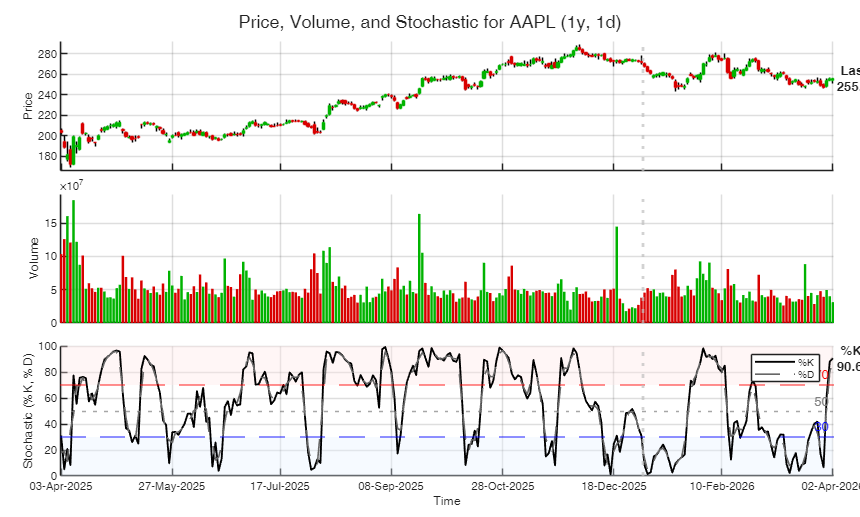
Processing ticker 1 of 5: AAPL
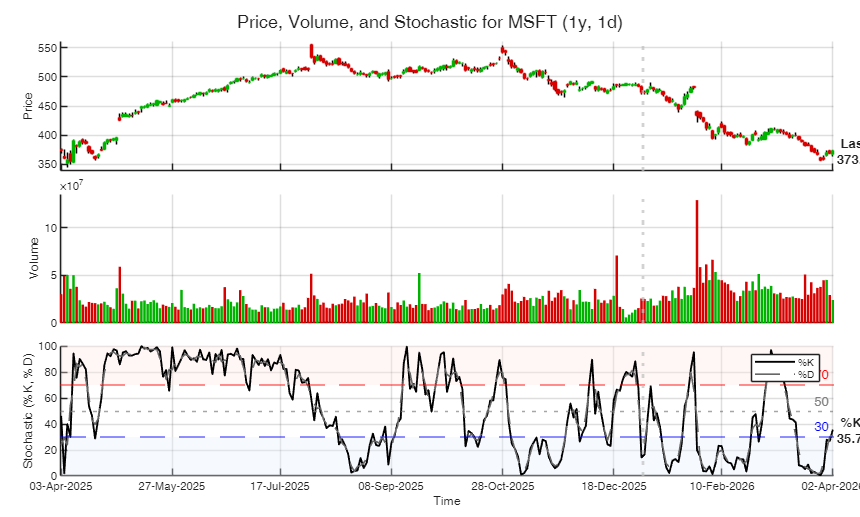
Processing ticker 2 of 5: MSFT
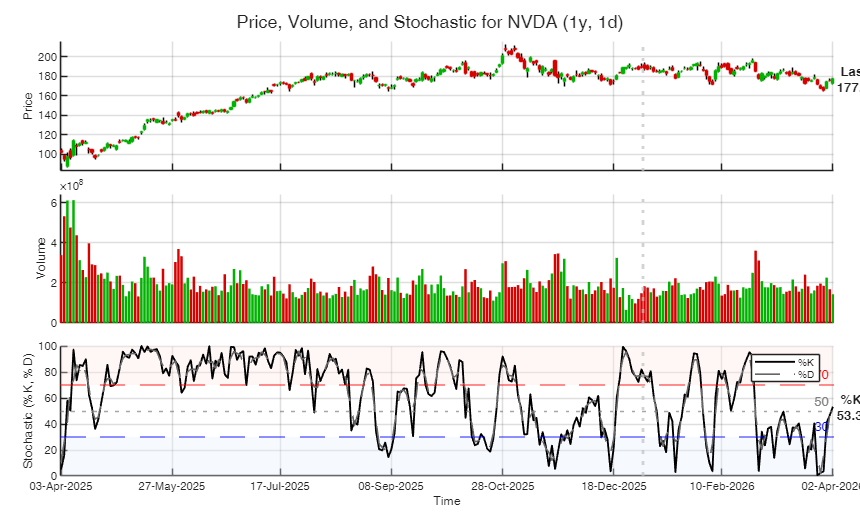
Processing ticker 3 of 5: NVDA
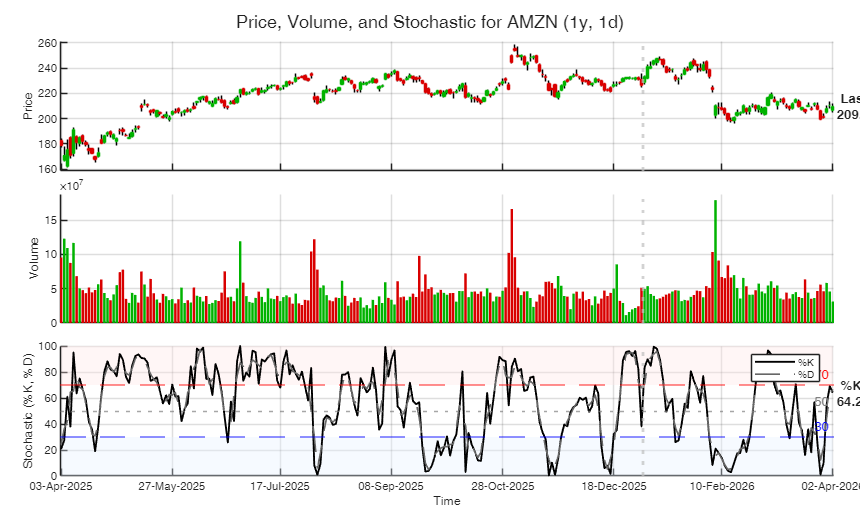
Processing ticker 4 of 5: AMZN
Processing ticker 5 of 5: GOOGL
5×1 struct array with fields:
Ticker
LastPeriod
intervalRequested
intervalActual
TimeZone
TT
Indicators
Success
Message
class
CompanyName TickerSymbol marketCap sector industry
_________________________ ____________ __________ __________________________ __________________________________
AppleInc_ {'Apple Inc.' } {'AAPL' } 3.7615e+12 {'Technology' } {'Consumer Electronics' }
MicrosoftCorporation {'Microsoft Corporation'} {'MSFT' } 2.7757e+12 {'Technology' } {'Software - Infrastructure' }
NVIDIACorporation {'NVIDIA Corporation' } {'NVDA' } 4.3115e+12 {'Technology' } {'Semiconductors' }
Amazon_com_Inc_ {'Amazon.com, Inc.' } {'AMZN' } 2.2519e+12 {'Consumer Cyclical' } {'Internet Retail' }
AlphabetInc_ {'Alphabet Inc.' } {'GOOGL'} 3.5779e+12 {'Communication Services'} {'Internet Content & Information'}
Line Chart with moving averages in the top panel and crossovers.
Line Chart with moving averages in the top panel and crossovers.
out = getYahoo('ENEL.MI','topPanelMode','ma','maFastLen',5,'maMidLen',20,'maSlowLen',50); ticker Name
_______ __________________
"^IXIC" "Nasdaq Composite"
"AAPL" "Apple"
"MSFT" "Microsoft"
"NVDA" "NVIDIA"
"AMZN" "Amazon"
"GOOGL" "Alphabet Class A"
Requested pair range=1y, interval=1m is not supported.
Using interval=1d instead.
Processing ticker 1 of 5: AAPL
Processing ticker 2 of 5: MSFT
Processing ticker 3 of 5: NVDA
Processing ticker 4 of 5: AMZN
Processing ticker 5 of 5: GOOGL
5×1 struct array with fields:
Ticker
LastPeriod
intervalRequested
intervalActual
TimeZone
TT
Indicators
Success
Message
class
CompanyName TickerSymbol marketCap sector industry
_________________________ ____________ __________ __________________________ __________________________________
AppleInc_ {'Apple Inc.' } {'AAPL' } 3.7615e+12 {'Technology' } {'Consumer Electronics' }
MicrosoftCorporation {'Microsoft Corporation'} {'MSFT' } 2.7757e+12 {'Technology' } {'Software - Infrastructure' }
NVIDIACorporation {'NVIDIA Corporation' } {'NVDA' } 4.3115e+12 {'Technology' } {'Semiconductors' }
Amazon_com_Inc_ {'Amazon.com, Inc.' } {'AMZN' } 2.2519e+12 {'Consumer Cyclical' } {'Internet Retail' }
AlphabetInc_ {'Alphabet Inc.' } {'GOOGL'} 3.5779e+12 {'Communication Services'} {'Internet Content & Information'}
Max history.
Max history.
out = getYahoo('G.MI','LastPeriod','max','interval','1wk','plots',false); ticker Name
_______ __________________
"^IXIC" "Nasdaq Composite"
"AAPL" "Apple"
"MSFT" "Microsoft"
"NVDA" "NVIDIA"
"AMZN" "Amazon"
"GOOGL" "Alphabet Class A"
Requested pair range=1y, interval=1m is not supported.
Using interval=1d instead.
Processing ticker 1 of 5: AAPL
Processing ticker 2 of 5: MSFT
Processing ticker 3 of 5: NVDA
Processing ticker 4 of 5: AMZN
Processing ticker 5 of 5: GOOGL
5×1 struct array with fields:
Ticker
LastPeriod
intervalRequested
intervalActual
TimeZone
TT
Indicators
Success
Message
class
CompanyName TickerSymbol marketCap sector industry
_________________________ ____________ __________ __________________________ __________________________________
AppleInc_ {'Apple Inc.' } {'AAPL' } 3.7615e+12 {'Technology' } {'Consumer Electronics' }
MicrosoftCorporation {'Microsoft Corporation'} {'MSFT' } 2.7757e+12 {'Technology' } {'Software - Infrastructure' }
NVIDIACorporation {'NVIDIA Corporation' } {'NVDA' } 4.3115e+12 {'Technology' } {'Semiconductors' }
Amazon_com_Inc_ {'Amazon.com, Inc.' } {'AMZN' } 2.2519e+12 {'Consumer Cyclical' } {'Internet Retail' }
AlphabetInc_ {'Alphabet Inc.' } {'GOOGL'} 3.5779e+12 {'Communication Services'} {'Internet Content & Information'}
With help.
With help.
out = getYahoo('G.MI','showPanelHelp',true); ticker Name
_______ __________________
"^IXIC" "Nasdaq Composite"
"AAPL" "Apple"
"MSFT" "Microsoft"
"NVDA" "NVIDIA"
"AMZN" "Amazon"
"GOOGL" "Alphabet Class A"
Requested pair range=1y, interval=1m is not supported.
Using interval=1d instead.
Processing ticker 1 of 5: AAPL
Processing ticker 2 of 5: MSFT
Processing ticker 3 of 5: NVDA
Processing ticker 4 of 5: AMZN
Processing ticker 5 of 5: GOOGL
5×1 struct array with fields:
Ticker
LastPeriod
intervalRequested
intervalActual
TimeZone
TT
Indicators
Success
Message
class
CompanyName TickerSymbol marketCap sector industry
_________________________ ____________ __________ __________________________ __________________________________
AppleInc_ {'Apple Inc.' } {'AAPL' } 3.7615e+12 {'Technology' } {'Consumer Electronics' }
MicrosoftCorporation {'Microsoft Corporation'} {'MSFT' } 2.7757e+12 {'Technology' } {'Software - Infrastructure' }
NVIDIACorporation {'NVIDIA Corporation' } {'NVDA' } 4.3115e+12 {'Technology' } {'Semiconductors' }
Amazon_com_Inc_ {'Amazon.com, Inc.' } {'AMZN' } 2.2519e+12 {'Consumer Cyclical' } {'Internet Retail' }
AlphabetInc_ {'Alphabet Inc.' } {'GOOGL'} 3.5779e+12 {'Communication Services'} {'Internet Content & Information'}
Input Arguments
Output Arguments
References
Damodaran, A. (2012), "Investment Valuation: Tools and Techniques for Determining the Value of Any Asset", 3rd Edition, Wiley.
Cochrane, J. H. (2023), "Asset Pricing, Revised Edition", Princeton University Press, Princeton.
Koller, T., Goedhart, M., and Wessels, D. (2020), "Valuation: Measuring and Managing the Value of Companies, 7th Edition", Wiley, Hoboken.
See Also
getTickers
|
getFundamentals
|
rsindex
|
candle
|
movavg