mdMCARtest

mdMCARtest Bootstrap test for change in Mahalanobis distances under MCAR

Syntax

Description

This function implements a parametric bootstrap test based on the change in Mahalanobis distances for the units without missing values when location and scatter are estimated:

1) using only the complete rows;

2) using all rows through EM/TEM in the presence of missing values.

The bootstrap null hypothesis is that the observed perturbation is compatible with MCAR. The null distribution is generated from a Gaussian model fitted on the complete rows and then the observed missingness mask is imposed on the generated data.

example

out =mdMCARtest(Y) Example 1: Basic call with default options.

example

out =mdMCARtest(Y, Name, Value) Example 2: Test with trimming.

Examples

expand all

  • Example 1: Basic call with default options.
  • Load data with missing values and run the test with default settings.

    load cows2026
    X = cows2026{:,:};
    out = mdMCARtest(X);
    % Display observed statistics and p-values
    disp(out.Tobs)
    disp(out.pvalue)
             -0.13         -0.17         -0.79         -1.14
    
              0.00          0.00          0.00          0.00


  • Example 2: Test with trimming.
  • Run the bootstrap test using TEM with trimming level alpha=0.25.

    load cows2026
    X = cows2026{:,:};
    out = mdMCARtest(X,'alpha',0.25,'nsimul',199);
    % Display p-values
    disp(out.pvalue)
              0.01          0.01          0.01          0.01


    Related Examples

    expand all

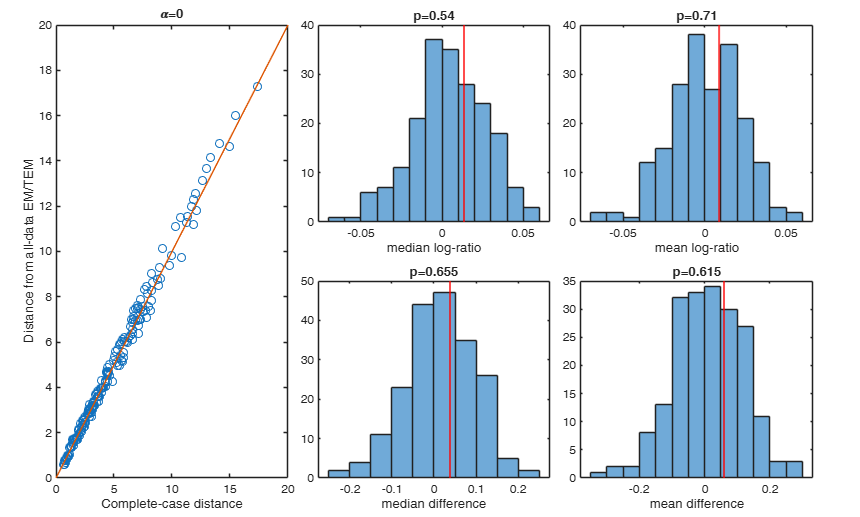
  • Example 3: Simulated data under MCAR.
  • Generate Gaussian data with MCAR missingness and apply the test.

    rng(1)
    n = 300;
    p = 5;
    rho = 0.5;
    Sigma = (1-rho)*eye(p) + rho*ones(p);
    mu = zeros(1,p);
    Yfull = mvnrnd(mu,Sigma,n);
    missRate = 0.10;
    missMask = rand(n,p) < missRate;
    Y = Yfull;
    Y(missMask) = NaN;
    % Show also the output plot
    out = mdMCARtest(Y,'nsimul',199,'plots',true);
    disp('Observed statistics:')
    disp(out.Tobs)
    disp('Bootstrap p-values:')
    disp(out.pvalue)
    Observed statistics:
              0.01          0.01          0.04          0.06
    
    Bootstrap p-values:
              0.54          0.71          0.66          0.61
    
    
    Click here for the graphical output of this example (link to Ro.S.A. website)

  • Example 4: Comparison of several trimming levels.
  • rng(1)
    n = 300;
    p = 5;
    rho = 0.5;
    Sigma = (1-rho)*eye(p) + rho*ones(p);
    mu = zeros(1,p);
    Yfull = mvnrnd(mu,Sigma,n);
    missRate = 0.10;
    missMask = rand(n,p) < missRate;
    Y = Yfull;
    Y(missMask) = NaN;    
    Alpha = [0 0.10 0.25 0.50]';
    pval = zeros(length(Alpha),4);
    for i=1:length(Alpha)
    out = mdMCARtest(Y,'alpha',Alpha(i),'nsimul',199);
    pval(i,:) = out.pvalue;
    end
    pvalTable = array2table(pval, ...
    'VariableNames',{'medLogRatio','meanLogRatio','medDiff','meanDiff'}, ...
    'RowNames',string(Alpha));
    disp(pvalTable)

  • Example 5: Different rescaling method.
  • Use method betaMap instead of the default pri.

    load cows2026
    X = cows2026{:,:};
    out = mdMCARtest(X,'alpha',0.25,'method','betaMap','nsimul',199);
    disp(out.pvalue)

    Input Arguments

    expand all

    Y — Input data. Matrix.

    n x p data matrix possibly containing NaNs.

    Rows of Y represent observations and columns represent variables.

    Data Types: double

    Name-Value Pair Arguments

    Specify optional comma-separated pairs of Name,Value arguments. Name is the argument name and Value is the corresponding value. Name must appear inside single quotes (' '). You can specify several name and value pair arguments in any order as Name1,Value1,...,NameN,ValueN.

    Example: 'alpha',0.25 , 'method','betaMap' , 'nsimul',999 , 'conflev',0.99 , 'tol',1e-8 , 'plots',true

    alpha —Trimming level.scalar.

    The default value is 0.

    If alpha=0, the function mdEM is used.

    If alpha>0, the function mdTEM is used.

    Example: 'alpha',0.25

    Data Types: double

    method —Rescaling method used inside mdTEM and mdPartialMD2full.the default value is 'pri'.

    Example: 'method','betaMap'

    Data Types: char | string

    nsimul —Number of bootstrap simulations.scalar integer.

    The default value is 499.

    Example: 'nsimul',999

    Data Types: double

    conflev —Confidence level used to compute bootstrap confidence intervals.scalar in the interval (0,1).

    The default value is 0.95.

    Example: 'conflev',0.99

    Data Types: double

    tol —Convergence tolerance passed to mdTEM.scalar.

    The default value is 1e-10.

    Example: 'tol',1e-8

    Data Types: double

    plots —Flag to produce the output plot.the default value is false.

    Example: 'plots',true

    Data Types: logical

    Output Arguments

    expand all

    out — description Structure

    Structure containing the following fields:

    Value Description
    pvalue

    1 x 4 vector containing the bootstrap p-values for the four statistics.

    Tobs

    1 x 4 vector containing the observed values of the four statistics.

    Tboot

    nsimul x 4 matrix containing the bootstrap values of the four statistics.

    alpha

    Value of input option alpha.

    method

    Value of input option method.

    nComplete

    Number of complete rows.

    completeIdx

    Logical index of complete rows.

    d2_cc

    Mahalanobis distances computed from complete rows only.

    d2_all

    Mahalanobis distances for the same complete rows when parameters are estimated from all the data through EM/TEM.

    ciBoot

    2 x 4 matrix containing the bootstrap confidence intervals for the four statistics.

    loc

    Estimated location from EM/TEM fit on all data.

    cov

    Estimated scatter from EM/TEM fit on all data.

    More About

    expand all

    Additional Details

    Let d2_cc denote the squared Mahalanobis distances computed on the complete rows using the complete-case estimates, and let d2_all denote the distances for the same rows when location and scatter are estimated from all the data using EM/TEM. The function monitors the following four statistics:

    1) median( log(d2_all ./ d2_cc) );

    2) mean ( log(d2_all ./ d2_cc) );

    3) median( d2_all - d2_cc );

    4) mean ( d2_all - d2_cc ).

    Small p-values indicate that the change in distances is larger than what is expected under the MCAR bootstrap model.

    References

    Little, R. J. A., & Rubin, D. B. (2019). Statistical Analysis with Missing Data (3rd ed.). Hoboken, NJ: John Wiley & Sons.

    Templ, M. (2023). Visualization and Imputation of Missing Values: With Applications in R. Cham, Switzerland: Springer Nature.

    This page has been automatically generated by our routine publishFS