
|
add2yX |
ASbdp |
 |
addt
addt produces the t test for an additional explanatory variable
Description
Examples
 addt with all default options.
addt with all default options.Compute the t test for an additional regressor.
XX=load('wool.txt');
y=log(XX(:,end));
X=XX(:,1:end-2);
w=XX(:,end-1);
[out]=addt(y,X,w);
% out.Tadd (equal to -8.9707) is exactly equal to stats.tstat.t(4)
% obtained as
whichstats = {'tstat','mse'};
stats = regstats(y,XX(:,1:end-1),'linear',whichstats);
% Similarly out.S2add (equal to 0.0345) is exactly equal to stats.mse (estimate of
% \sigma^2 for augmented model)
addt with optional arguments.
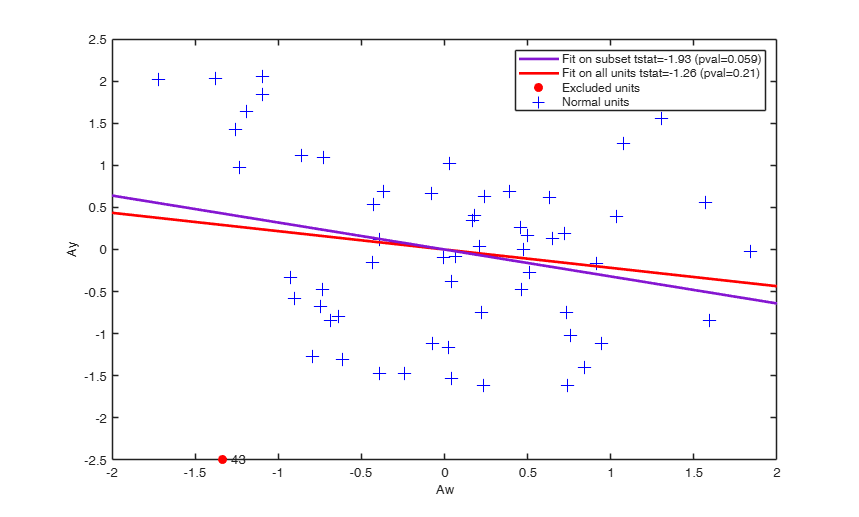
addt with optional arguments.Excluding one observation from the sample; compare the added variable plot based on all units with that which excludes unit 43.
load('multiple_regression.txt');
y=multiple_regression(:,4);
X=multiple_regression(:,1:3);
[out]=addt(y,X(:,2:3),X(:,1),'plots',1,'units',[43],'textlab',true);
Related Examples
Excluding more than one observation from the sample.
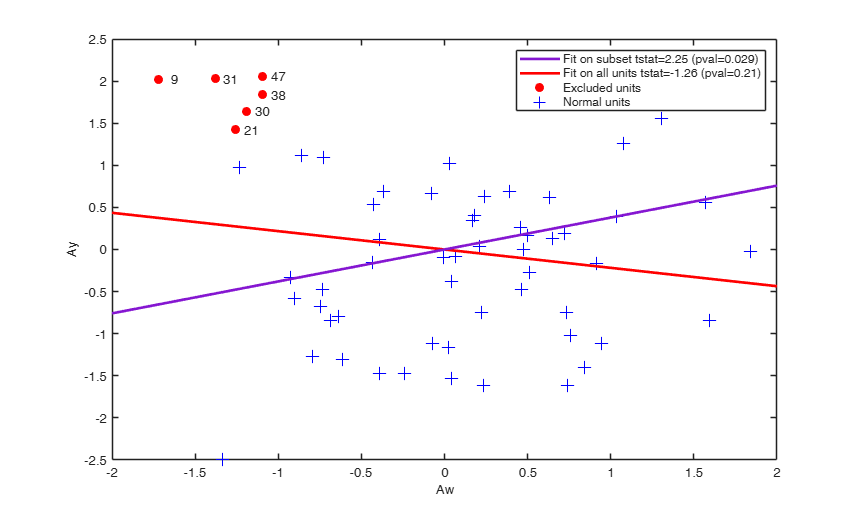
Excluding more than one observation from the sample.Compare the added variable plot based on all units with that which excludes units 9,21,30,31,38 and 47.
load('multiple_regression.txt');
y=multiple_regression(:,4);
X=multiple_regression(:,1:3);
[out]=addt(y,X(:,2:3),X(:,1),'plots',1,'units',[9 21 30 31 38 47]','textlab',true);
Input Arguments
Output Arguments
References
Atkinson, A.C. and Riani, M. (2000), "Robust Diagnostic Regression Analysis", Springer Verlag, New York.
See Also
|
|
add2yX |
ASbdp |
|
|
|
Functions |
|
• The developers of the toolbox • The forward search group • Terms of Use • Acknowledgments