upperfracpos
upperfracpos positions two figures on the upper part of the screen.
Syntax
upperfracpos(hfigl , hfigr , fraction)example
Examples
 Example of use of upperfracpos.
Example of use of upperfracpos.
close all;
% create two figures, rescale and position them
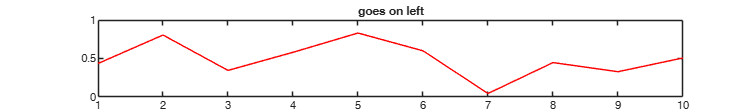
hfigl = figure; plot(sin(rand(10,1)),'r'); title('goes on left');
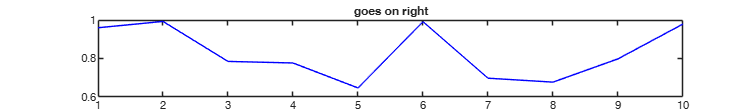
hfigr = figure; plot(cos(rand(10,1)),'b'); title('goes on right');
upperfracpos(hfigl , hfigr , 0.5);
% now rescale the figures to a smaller proportion
upperfracpos(hfigl , hfigr , 0.2);
% this is just to bring the rescaled figures in the screen foreground
figure(hfigl); figure(hfigr);
Input Arguments
Output Arguments
References
Tufte E.R. (1983), "The visual display of quantitative information", Graphics Press, Cheshire.