GUIquantile

GUIquantile shows the necessary calculations to obtain $x_z$ quantile.

Syntax

  • out=GUIquantile(x, z)example
  • out=GUIquantile(x, z,Name,Value)example

Description

example

out =GUIquantile(x, z) Percentile "z" in an individual series.

example

out =GUIquantile(x, z, Name, Value) Computation of the median in presence of discrete data with frequencies.

Examples

expand all

  • Percentile "z" in an individual series.
  • In this case we find percentile 43, all frequencies are equal to 1.

    x=[2 10 5 9 13];
    GUIquantile(x,0.43)

  • Computation of the median in presence of discrete data with frequencies.
  • X = Number of components of Italian families (source ISTAT).

    % freq = Number of families (in thousands).
    x=1:6;
    freq=[7910 6833 5116 4051 1088  303];
    out=GUIquantile(x,0.5,'freq',freq,'DiscreteData',true);
    disp(out)

    Related Examples

    expand all

  • Computation of the median in presence of discrete data with frequencies and related plot.
  • (See page 14 of [CMR]) X = 133 students grades on a given exam freq = frequencies.

    x=18:30;
    freq=[12 10 4 8 7 19 22 8 9 13 10 8 3 ];
    % Find 83 percentile and show associated plot.
    GUIquantile(x,0.83,'freq',freq,'DiscreteData',true,'plots',true)

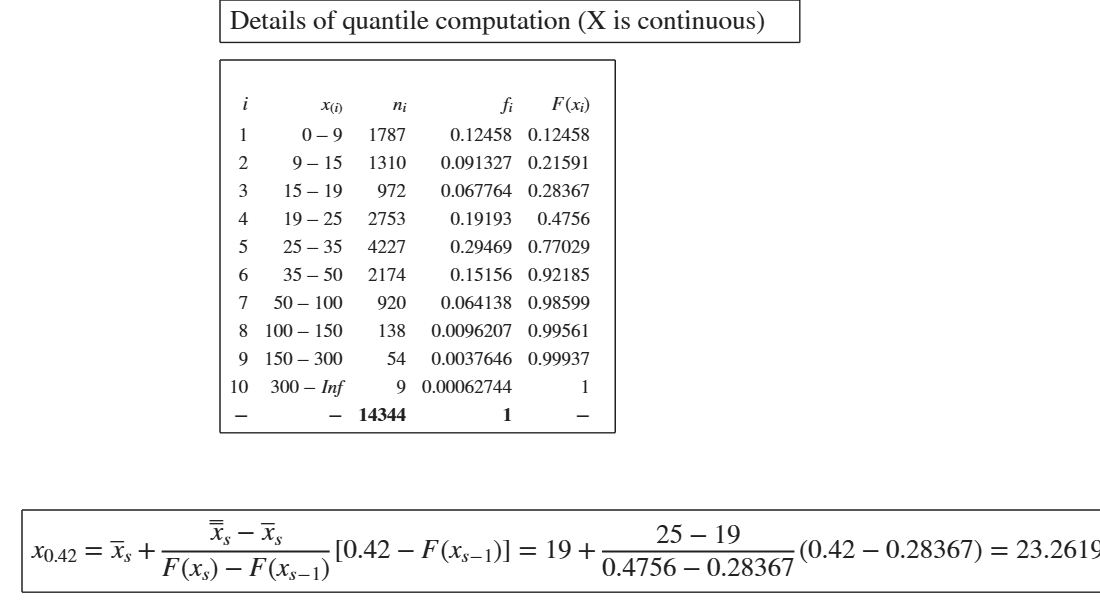
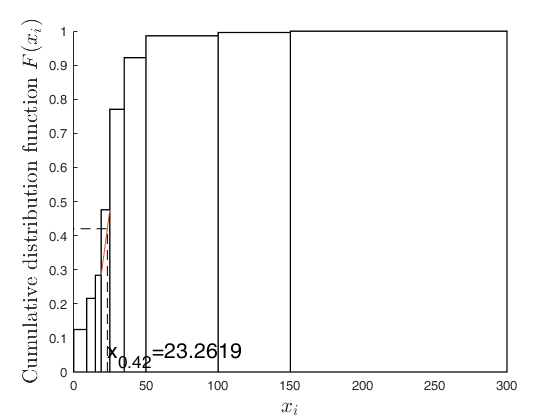
  • Example of computation of 40 per cent percentile in a frequency distribution (X is continuous).
  • % The following frequency distribution shows the amount (in thousands
    % of Euros) of advertising expenditure made in a given month by a series of
    % companies. (See page 15 of [CMR])
    X=[9  1787
    15  1310
    19  972
    25  2753
    35  4227
    50  2174
    100 920
    150  138
    300  54
    Inf  9];
    x=[0;X(:,1)];
    freq=X(:,2);
    out=GUIquantile(x,0.42,'freq',freq,'DiscreteData',false,'plots',1)
    out = 
    
      struct with fields:
    
            data: [11×5 table]
        quantile: 23.2619
    
    
    Click here for the graphical output of this example (link to Ro.S.A. website)

    Input Arguments

    expand all

    x — vector of numeric data. Vector.

    Vector containing strictly numerical data.

    Note that if x is referred to a continuous variable x(1) represent the lower extreme of the first class, and the other values of x contain the upper extremes of the other classes.

    Data Types: double, ordered categorical

    z — requested probability. Scalar.

    Requested probabilities for which to compute the quantile, specified as a scalar.

    Data Types: double

    Name-Value Pair Arguments

    Specify optional comma-separated pairs of Name,Value arguments. Name is the argument name and Value is the corresponding value. Name must appear inside single quotes (' '). You can specify several name and value pair arguments in any order as Name1,Value1,...,NameN,ValueN.

    Example: 'freq',1:10 , 'DiscreteData',false , 'plots',true

    freq —frequencies.vector.

    Vector of the same length of x containing the frequencies (weights) associated to each value of x if x is discrete or vector with length (x)-1 if variable X is continuous. If freq is not supplied, it is assumed that all observations have the same (relative) frequency (weight).

    Example: 'freq',1:10

    Data Types: double

    DiscreteData —Discrete data or continuous data.boolean.

    If DiscreteData is true (default), we assume that the data in x come from a discrete variable.

    If DiscreteData is false, we assume that the data in x come from a continuous variable.

    Example: 'DiscreteData',false

    Data Types: boolean

    plots —show quantile graphically.boolean.

    If plots is true an additional plot which shows graphically how the quantile has been obtained using the linear interpolation is displayed on the screen. The default value of plots is false.

    Example: 'plots',true

    Data Types: boolean

    Output Arguments

    expand all

    out — description Structure

    detailed output to compute the index. struct.

    Value Description
    quantile

    shows the value of the quantile which has been found.

    data

    table with n+1 rows (where n is the length of x) containing what is shown in the GUI. Last row contains the totals. This field is present only if optional input freq is supplied.

    References

    Cerioli, A., Milioli, M.A., Riani, M. (2016), "Esercizi di statistica (Quinta edizione)". [CMR]

    This page has been automatically generated by our routine publishFS