OptimalCuttingFrequency
OptimalCuttingFrequency computes the optimal cutting frequency for the Fourier estimator of integrated variance
Syntax
Nopt=OptimalCuttingFrequency(x,t)example
Description
OptimalCuttingFrequency computes the optimal cutting frequency for running the Fourier estimator of the integrated variance on noisy timeseries data.
Examples
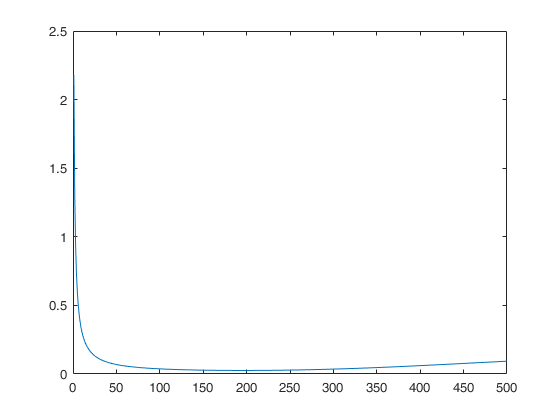
 Computation of the optimal cutting frequency for estimating the integrated variance from a
vector x of noisy observations of a univariate diffusion process.
Computation of the optimal cutting frequency for estimating the integrated variance from a
vector x of noisy observations of a univariate diffusion process.
Computation of the optimal cutting frequency for estimating the integrated variance from a
vector x of noisy observations of a univariate diffusion process.
% Generate data.
n=1000;
dt=1/n;
t=0:dt:1;
x=randn(n,1)*sqrt(dt);
% generate the diffusion process
x=[0;cumsum(x)];
% Add noise:
noise_to_signal =0.5; % noise-to-signal ratio
sigma_eps = noise_to_signal*std(diff(x));
noise=sigma_eps*randn(size(x));
% add noise, which is i.i.d. N(0,sigma_eps^2)
x=x+noise;
Nopt = OptimalCuttingFrequency(x,t); % optimal cutting frequency
ivar=FE_int_vol(x,t,'N',Nopt);
disp(['The optimal cutting frequency is: ' num2str(Nopt)])
disp(['The value of the integrated variance is: ' num2str(ivar)])
The optimal cutting frequency is: 196
The value of the integrated variance is: 1.1651
Input Arguments
Output Arguments
More About
References
Mancino, M.E., Recchioni, M.C., Sanfelici, S. (2017), Fourier-Malliavin Volatility Estimation. Theory and Practice, "Springer Briefs in Quantitative Finance", Springer.
Sanfelici, S., Toscano, G. (2024), The Fourier-Malliavin Volatility (FMVol) MATLAB toolbox, available on ArXiv.