dempk
dempk performs a merging of components found by tkmeans
Description
The function dempk performs either a hierarchical merging of the k components found by tkmeans (using the pairwise overlap values between them and giving g clusters), or if g is a decimal number between 0 and 1 it performs the merging phase according to the threshold g (the same algorithm as overlapmap).
Examples
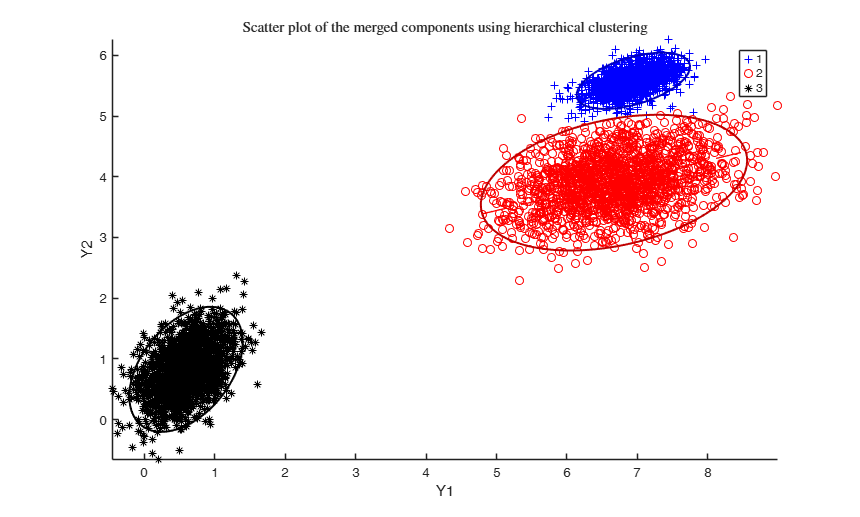
 Example using dempk on data obtained by simdataset, specifying both
hierarchical clustering and a threshold value, in order to obtain
additional plots.
Example using dempk on data obtained by simdataset, specifying both
hierarchical clustering and a threshold value, in order to obtain
additional plots.
Example using dempk on data obtained by simdataset, specifying both
hierarchical clustering and a threshold value, in order to obtain
additional plots.
close all
% Specify k cluster in v dimensions with n obs
k = 10;
v = 2;
n = 5000;
% Generate homogeneous and spherical clusters
rng(100, 'twister');
out = MixSim(k, v, 'sph', true, 'hom', true, 'int', [0 10], 'Display', 'off', 'BarOmega', 0.05, 'Display','off');
% Simulating data
[X, id] = simdataset(n, out.Pi, out.Mu, out.S);
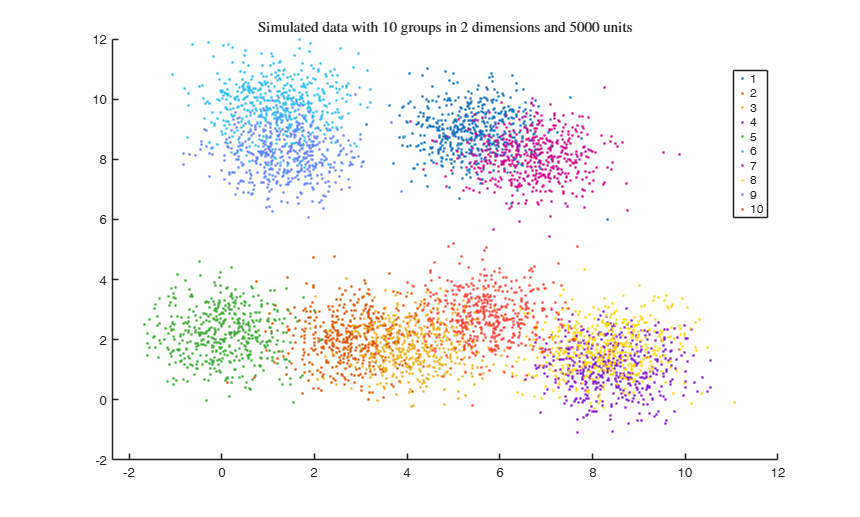
% Plotting data
gscatter(X(:,1), X(:,2), id);
str = sprintf('Simulated data with %d groups in %d dimensions and %d units', k, v, n);
title(str,'Interpreter','Latex');
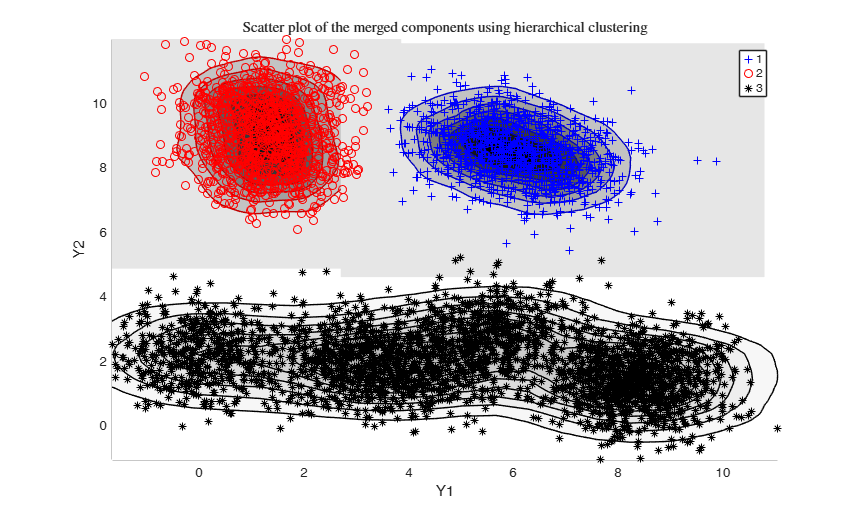
% merging algorithm based on hierarchical clustering
g = 3;
DEMP = dempk(X, k*5, g, 'plots', 'contourf');
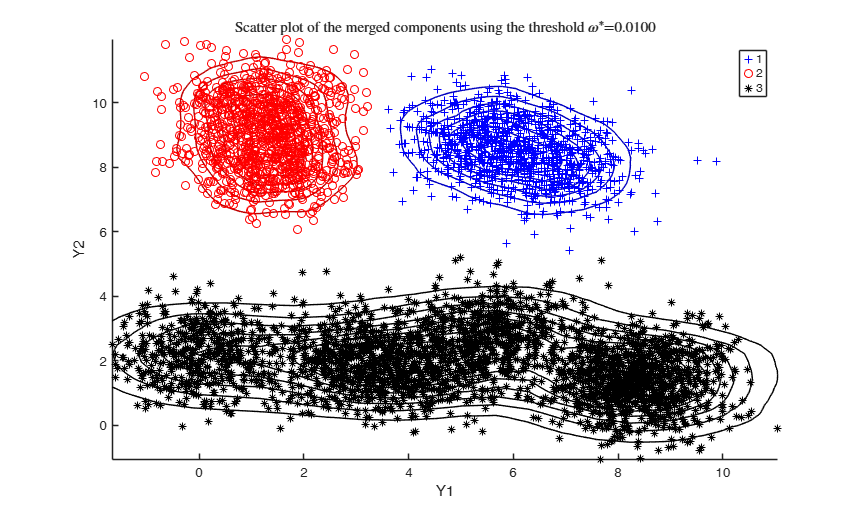
% merging algorithm based on the threshold value omega star
g = 0.01;
DEMP2 = dempk(X, k*5, g, 'plots', 'contour');Total estimated time to complete trimmed k means: 24.83 seconds ------------------------------ Warning: Number of subsets without convergence equal to 36.6667% Total estimated time to complete trimmed k means: 1.16 seconds ------------------------------ Warning: Number of subsets without convergence equal to 38.6667%
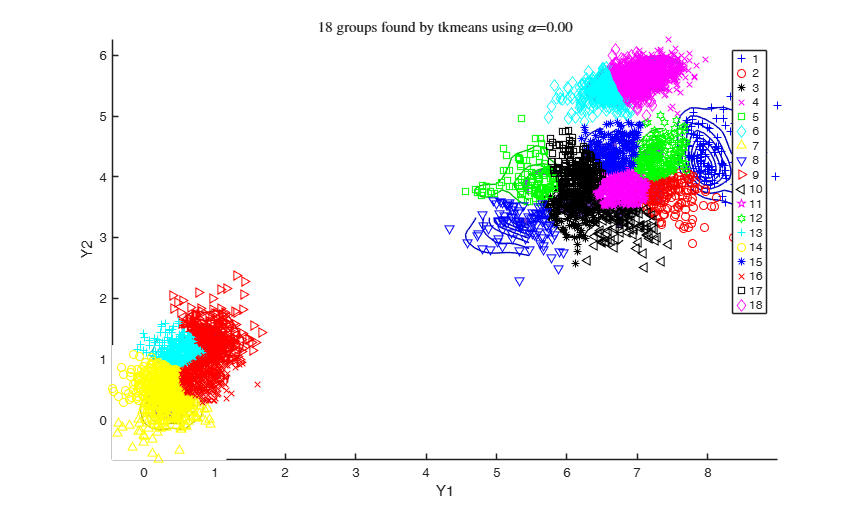
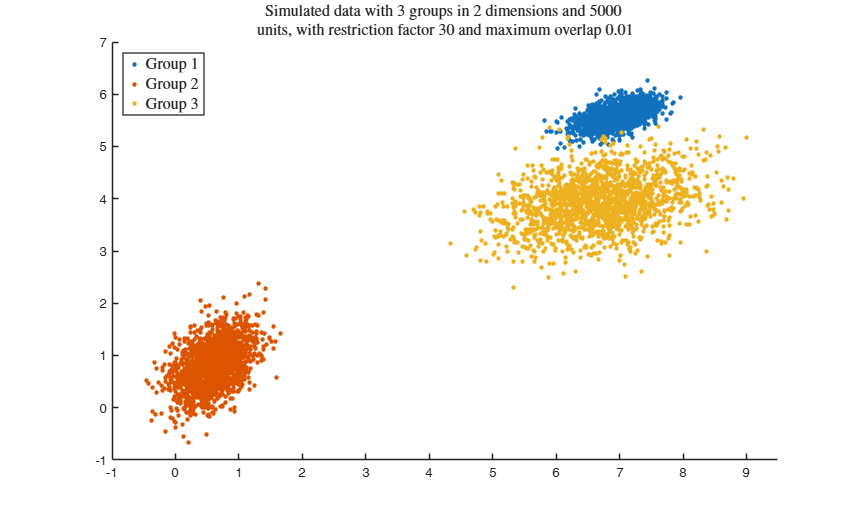
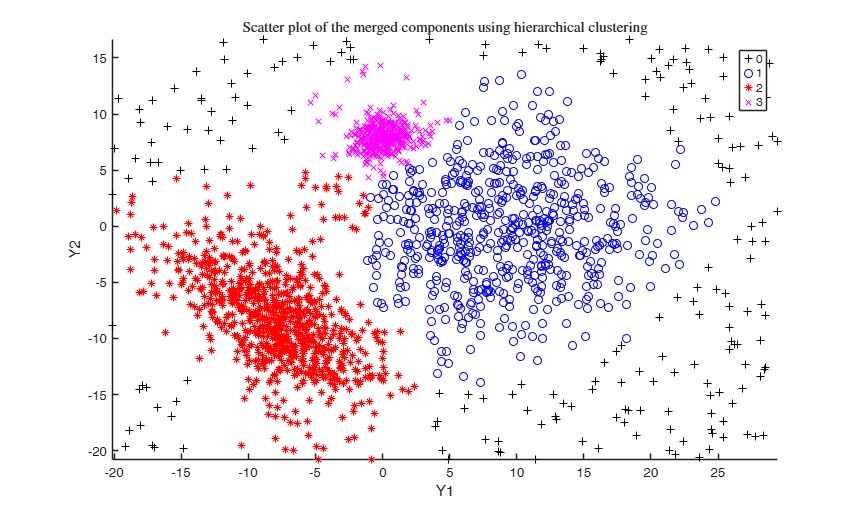
Example using dempk with hierarchical merging on data obtained by
simdataset, specifying additional arguments in the call to tkmeans.
Example using dempk with hierarchical merging on data obtained by
simdataset, specifying additional arguments in the call to tkmeans.
close all
% Specify k cluster in v dimensions with n obs
g = 3;
v = 2;
n = 5000;
% null trimming and noise level
alpha0 = 0;
% restriction factor
restr = 30;
% Maximum overlap
maxOm = 0.005;
% Generate heterogeneous and elliptical clusters
rng(500, 'twister');
out = MixSim(g, v, 'sph', false, 'restrfactor', restr, 'int', [0 10], ...
'Display', 'off', 'MaxOmega', maxOm, 'Display','off');
% Simulating data
[X, id] = simdataset(n, out.Pi, out.Mu, out.S);
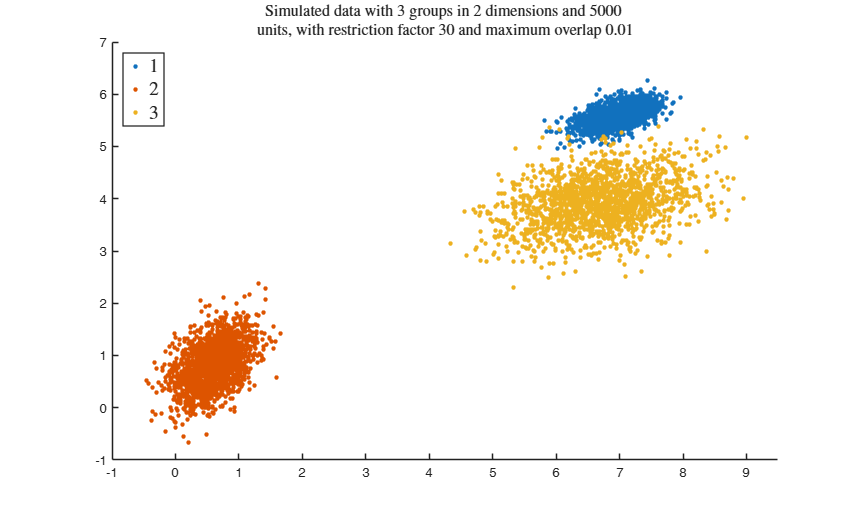
% Plotting data
gg = gscatter(X(:,1), X(:,2), id);
str = sprintf('Simulated data with %d groups in %d dimensions and %d \nunits, with restriction factor %d and maximum overlap %.2f', ...
g, v, n, restr, maxOm);
title(str,'Interpreter','Latex', 'fontsize', 12);
set(findobj(gg), 'MarkerSize',10);
legend1 = legend(gca,'show');
set(legend1,'LineWidth',1,'Interpreter','latex','FontSize',14, 'Location', 'northwest')
% number of components searched by tkmeans
k = g * 6;
% additional input for tkmeans
tkmeansOpt = struct;
tkmeansOpt.reftol = 0.0001;
tkmeansOpt.msg = 1;
tkmplots = struct;
tkmplots.type = 'contourf';
tkmplots.cmap = [0.3 0.2 0.4; 0.4 0.5 0.5; 0.1 0.7 0.9; 0.5 0.3 0.8; 1 1 1];
tkmeansOpt.plots = tkmplots;
tkmeansOpt.nomes = 0;
% saving tkmeans output
tkmeansOut = 1;
DEMP = dempk(X, k, g, 'tkmeansOpt', tkmeansOpt, 'plots', 'ellipse');Total estimated time to complete trimmed k means: 0.49 seconds ------------------------------ Warning: Number of subsets without convergence equal to 21.6667%

Related Examples
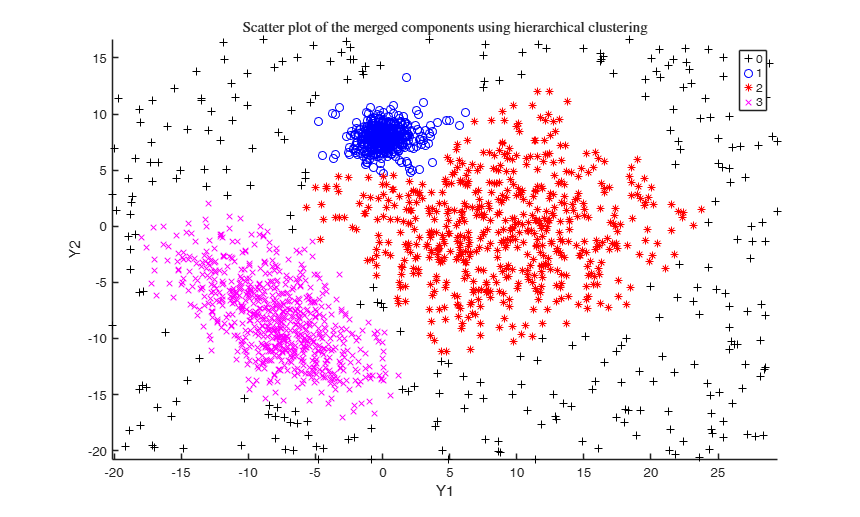
Example using dempk with hierarchical merging on data obtained by
simdataset, specifying additional arguments in the call to clusterdata.
Example using dempk with hierarchical merging on data obtained by
simdataset, specifying additional arguments in the call to clusterdata.
close all
% Specify k cluster in v dimensions with n obs
g = 3;
v = 2;
n = 5000;
% null trimming and noise level
alpha0 = 0;
% restriction factor
restr = 30;
% Maximum overlap
maxOm = 0.005;
% Generate heterogeneous and elliptical clusters
rng(500, 'twister');
out = MixSim(g, v, 'sph', false, 'restrfactor', restr, 'int', [0 10], ...
'Display', 'off', 'MaxOmega', maxOm, 'Display','off');
% Simulating data
[X, id] = simdataset(n, out.Pi, out.Mu, out.S);
% Plotting data
gg = gscatter(X(:,1), X(:,2), id);
str = sprintf('Simulated data with %d groups in %d dimensions and %d \nunits, with restriction factor %d and maximum overlap %.2f', ...
g, v, n, restr, maxOm);
title(str,'Interpreter','Latex', 'fontsize', 12);
set(findobj(gg), 'MarkerSize',10);
legend1 = legend(gca,'Group 1','Group 2','Group 3');
set(legend1,'LineWidth',1,'Interpreter','latex','FontSize',12, 'Location', 'northwest')
% number of components searched by tkmeans
disp('RUNNING TKMEANS WITH 18 COMPONENTS; THEN MERGING WITH dempk');
k = g * 6;
% additional input for clusterdata (i.e. hierOpt)
linkagearg = 'weights';
DEMP = dempk(X, k, g, 'linkagearg', linkagearg, 'plots', 'ellipse');
RUNNING TKMEANS WITH 18 COMPONENTS; THEN MERGING WITH dempk Total estimated time to complete trimmed k means: 0.41 seconds ------------------------------ Warning: Number of subsets without convergence equal to 37.3333%
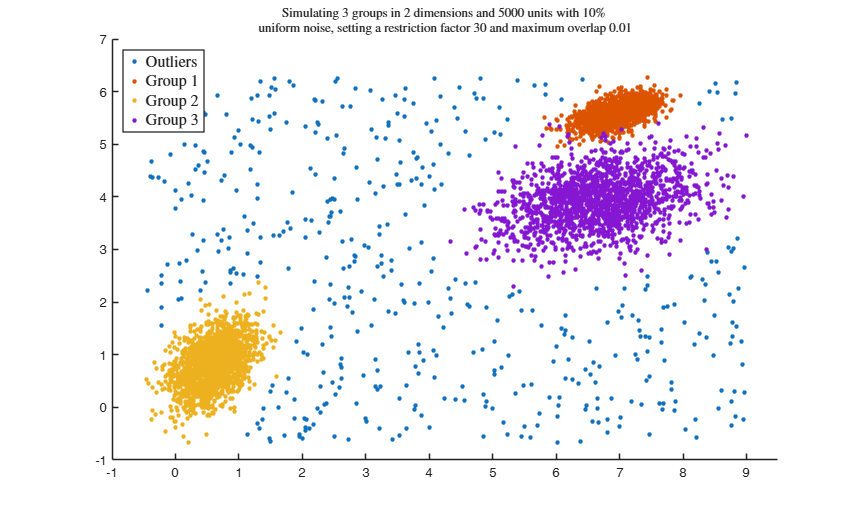
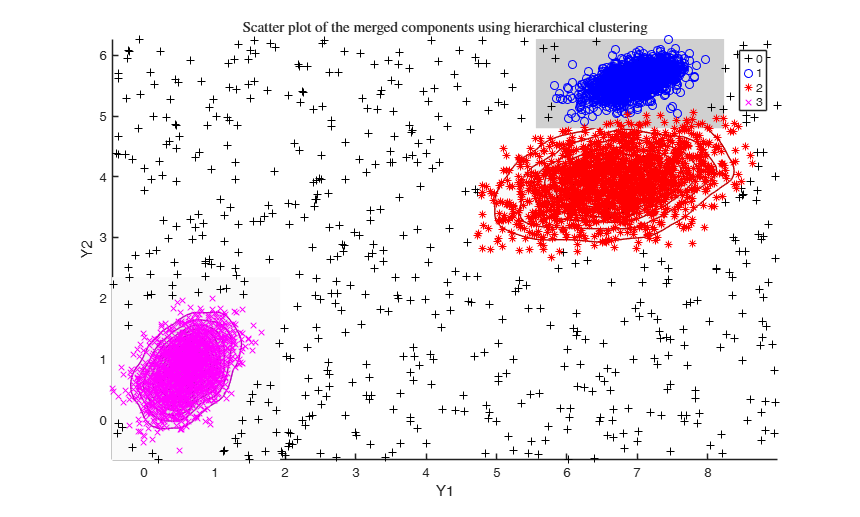
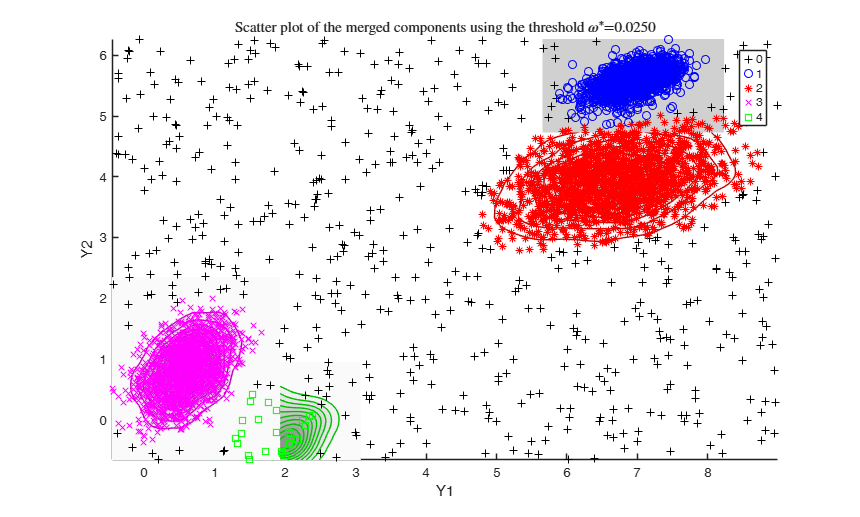
Example using dempk, both setting a threshold and performing a
hierarchical merging, for data obtained by simdataset with 10 percent
uniform noise.
Example using dempk, both setting a threshold and performing a
hierarchical merging, for data obtained by simdataset with 10 percent
uniform noise.
close all
% Specify k cluster in v dimensions with n obs
g = 3;
v = 2;
n = 5000;
% 10 percent trimming and uniform noise
alpha = 0.1;
noise = alpha*n;
% restriction factor
restr = 30;
% Maximum overlap
maxOm = 0.005;
% Generate heterogeneous and elliptical clusters
rng(500, 'twister');
out = MixSim(g, v, 'sph', false, 'restrfactor', restr, 'int', [0 10], ...
'Display', 'off', 'MaxOmega', maxOm, 'Display','off');
% Simulating data
[X,id] = simdataset(n, out.Pi, out.Mu, out.S, 'noiseunits', noise);
% Plotting data
gg = gscatter(X(:,1), X(:,2), id);
str = sprintf('Simulating %d groups in %d dimensions and %d units with %d%s \nuniform noise, setting a restriction factor %d and maximum overlap %.2f', ...
g, v, n, alpha*100, '\%', restr, maxOm);
title(str,'Interpreter','Latex', 'fontsize', 10);
set(findobj(gg), 'MarkerSize',10);
legend1 = legend(gca,'Outliers','Group 1','Group 2','Group 3');
set(legend1,'LineWidth',1,'Interpreter','latex','FontSize',12, 'Location', 'northwest')
% fixing the number of components searched by tkmeans
k = g * 6;
% dempk with hierarchical merging and trimming equal to the level of noise
DEMP = dempk(X, k, g, 'alpha', alpha, 'plots', 'contourf');
% dempk with a threshold value and trimming equal to the level of noise
g = 0.025;
DEMP = dempk(X, k, g, 'alpha', alpha, 'plots', 'contourf');
Total estimated time to complete trimmed k means: 8.37 seconds ------------------------------ Warning: Number of subsets without convergence equal to 38% Total estimated time to complete trimmed k means: 8.23 seconds ------------------------------ Warning: Number of subsets without convergence equal to 36%
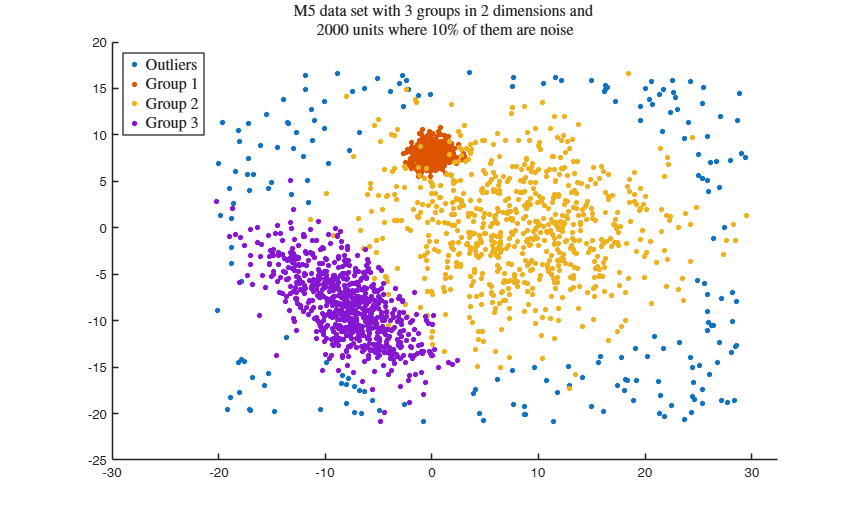
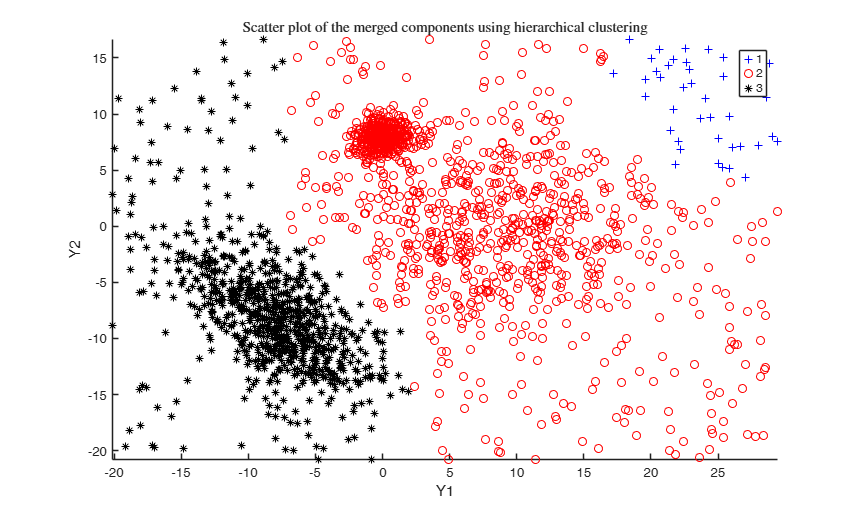
Example using the M5 dataset and various setting for dempk, using
hierarchical clustering, in order to identify the real clusters using
different strategies.
Example using the M5 dataset and various setting for dempk, using
hierarchical clustering, in order to identify the real clusters using
different strategies.
close all
Y = load('M5data.txt');
id = Y(:,3);
Y = Y(:, 1:2);
G = max(id);
n = length(Y);
noise = length(Y(id==0, 1));
v = 2; % dimensions
id(id==0) = -1; % changing noise label
gg = gscatter(Y(:,1), Y(:,2), id);
str = sprintf('M5 data set with %d groups in %d dimensions and \n%d units where %d%s of them are noise', G, v, n, noise/n*100, '\%');
title(str,'Interpreter','Latex', 'fontsize', 12);
set(findobj(gg), 'MarkerSize',12);
legend1 = legend(gca,'Outliers','Group 1','Group 2','Group 3');
set(legend1,'LineWidth',1,'Interpreter','latex','FontSize',12, 'Location', 'northwest')
% number of components to search
k = G*5;
% null trimming and noise level
alpha0 = 0;
% mimimum overlap cut-off value between pair of merged components
omegaStar = 0.045;
DEMP = dempk(Y, k, G, 'alpha', alpha0, 'tkmeansOut', 1, 'plots', 1);
% setting alpha equal to noise level (usually not appropriate)
alpha = noise/n;
DEMP2 = dempk(Y, k, G, 'alpha', alpha, 'tkmeansOut', 1, 'plots', 1);
% setting alpha greater than the noise level (almost always appropriate)
out = dempk(Y, k, G, 'alpha', alpha+0.04, 'tkmeansOut', 1, 'plots', 1);
Total estimated time to complete trimmed k means: 0.24 seconds ------------------------------ Warning: Number of subsets without convergence equal to 36% Total estimated time to complete trimmed k means: 2.51 seconds ------------------------------ Warning: Number of subsets without convergence equal to 39% Total estimated time to complete trimmed k means: 2.46 seconds ------------------------------ Warning: Number of subsets without convergence equal to 38.6667%
Input Arguments
Output Arguments
References
Melnykov, V., Michael, S. (2020), Clustering Large Datasets by Merging K-Means Solutions, Journal of Classification, Vol. 37, pp. 97–123, https://doi.org/10.1007/s00357-019-09314-8
Melnykov, V. (2016), Merging Mixture Components for Clustering Through Pairwise Overlap, "Journal of Computational and Graphical Statistics", Vol. 25, pp. 66-90.