funnelchart
funnelchart displays a funnel chart
Description
Funnel chart provides a graphic representation of data values across multiple stages in a process. The chart displays progressively decreasing values in proportions amounting to 100 percent in total. For example, you could use a funnel chart to show the number of sales prospects at each stage in a sales pipeline. Typically, the values decrease gradually, allowing the bars to resemble a funnel. This type of chart can also be useful in identifying potential problem areas in an organization’s sales processes. A funnel chart is similar to a stacked percent bar chart. For more details see: https://en.wikipedia.org/wiki/Funnel_chart
funnelchart with Labels option.h
=funnelchart(x,
Name, Value)
Examples
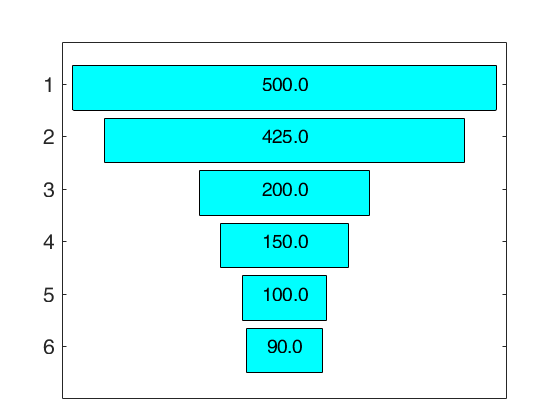
 funnelchart with all default options.
funnelchart with all default options.
x=[500 425 200 150 100 90];
funnelchart(x)
ans =

  Figure (1) with properties:

      Number: 1
        Name: ''
       Color: [0.9400 0.9400 0.9400]
    Position: [488 242 560 420]
       Units: 'pixels'

  Use GET to show all properties

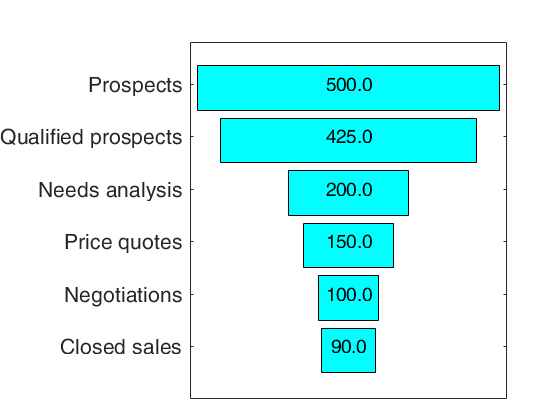
funnelchart with Labels option.
funnelchart with Labels option.
x=[500 425 200 150 100 90];
labels={'Prospects', 'Qualified prospects', 'Needs analysis', 'Price quotes', ...
'Negotiations', 'Closed sales'};
funnelchart(x,'Labels',labels)
ans =

  Figure (2) with properties:

      Number: 2
        Name: ''
       Color: [0.9400 0.9400 0.9400]
    Position: [488 242 560 420]
       Units: 'pixels'

  Use GET to show all properties
Related Examples
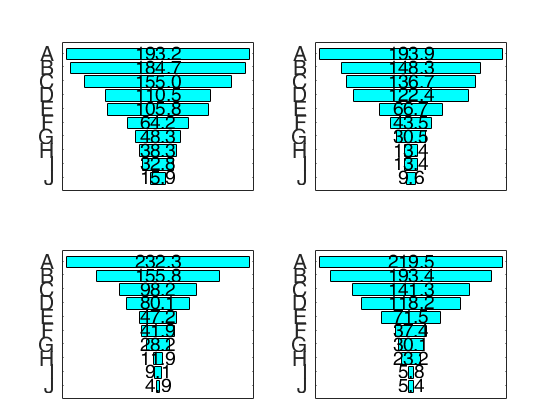
funnelchart when x is a matrix.
funnelchart when x is a matrix.
x=100*abs(randn(10,4));
x=sort(x,1,'descend');
labels={'A', 'B', 'C', 'D', 'E', ...
'F', 'G' 'H', 'I' 'J'};
funnelchart(x,'Labels',labels)
ans =

  Figure (3) with properties:

      Number: 3
        Name: ''
       Color: [0.9400 0.9400 0.9400]
    Position: [488 242 560 420]
       Units: 'pixels'

  Use GET to show all properties
funnelchart with a non-default color.
funnelchart with a non-default color.
x=100*abs(randn(10,4));
x=sort(x,1,'descend');
labels={'A', 'B', 'C', 'D', 'E', ...
'F', 'G' 'H', 'I' 'J'};
funnelchart(x,'Labels',labels,'Color',aux.FSColors.greysh.RGB)
ans =

  Figure (4) with properties:

      Number: 4
        Name: ''
       Color: [0.9400 0.9400 0.9400]
    Position: [488 242 560 420]
       Units: 'pixels'

  Use GET to show all properties

funnelchart with a title.
funnelchart with a title.
x=100*abs(randn(10,4));
x=sort(x,1,'descend');
labels={'A', 'B', 'C', 'D', 'E', ...
'F', 'G' 'H', 'I' 'J'};
funnelchart(x,'Labels',labels,'Title','A Funnel Chart')
ans =

  Figure (5) with properties:

      Number: 5
        Name: ''
       Color: [0.9400 0.9400 0.9400]
    Position: [488 242 560 420]
       Units: 'pixels'

  Use GET to show all properties