FSRcp
FSRcp monitors Cp and AIC for all models of interest of size smallp
Description
Examples
FSRcp with all default options.
Extract the best models of size 4.
% Common part to all examples: load Ozone dataset.
X=load('ozone.txt');
% Transform the response using logs
X(:,end)=log(X(:,end));
% Add a time trend
X=[(-40:39)' X];
% Define y
y=X(:,end);
% Define X
X=X(:,1:end-1);
smallp=4;
[Cpmon]=FSRcp(y,X,smallp);
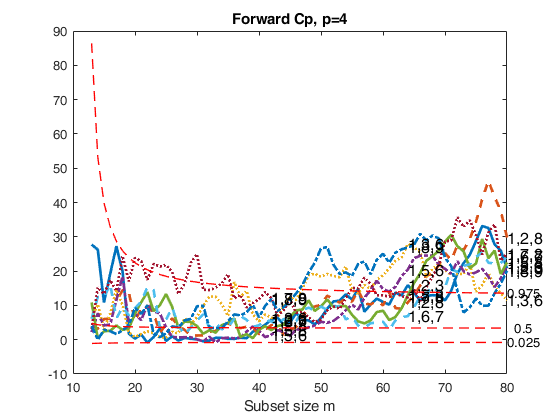
 FSRcp with optional arguments.
FSRcp with optional arguments.Extract the best models of size 4, and show the plot of forward Cp.
X=load('ozone.txt');
% Transform the response using logs
X(:,end)=log(X(:,end));
% Add a time trend
X=[(-40:39)' X];
% Define y
y=X(:,end);
% Define X
X=X(:,1:end-1);
smallp=4;
[outCp]=FSRcp(y,X,smallp,'plots',1);
Warning: Rank deficient, rank = 3, tol =  2.056162e-11.
Warning: Rank deficient, rank = 3, tol =  2.512148e-11.
Warning: Rank deficient, rank = 3, tol =  2.997602e-11.
Related Examples
Use labels defined by the user.
Extract the best models of size 4 and show the plot of Cp. All the default options are used, apart from labels, therefore the plot of Cp and the output matrix Cpmon.MAL only contains the searches associated with the smallest 3 values of Cp in the last 16 steps of the search.
X=load('ozone.txt');
% Transform the response using logs
X(:,end)=log(X(:,end));
% Add a time trend
X=[(-40:39)' X];
% Define y
y=X(:,end);
% Define X
X=X(:,1:end-1);
smallp=4;
labels={'Time','1','2','3','4','5','6','7','8'};
[Cpmon]=FSRcp(y,X,smallp,'plots',1,'labels',labels);
Extract and show the trajectories of all models of size 4 of Cp.
Notice that in this last case the forward plot becomes unreadable.
X=load('ozone.txt');
% Transform the response using logs
X(:,end)=log(X(:,end));
% Add a time trend
X=[(-40:39)' X];
% Define y
y=X(:,end);
% Define X
X=X(:,1:end-1);
smallp=4;
[Cpmon]=FSRcp(y,X,smallp,'plots',1,'fin_step','');
Extract the best models of size 5 and plot monitoring of Cp.
Extract 1000 subsets to initialize the search and use labels defined by the user.
X=load('ozone.txt');
% Transform the response using logs
X(:,end)=log(X(:,end));
% Add a time trend
X=[(-40:39)' X];
% Define y
y=X(:,end);
% Define X
X=X(:,1:end-1);
smallp=5;
labels={'Time','1','2','3','4','5','6','7','8'};
[Cpmon]=FSRcp(y,X,smallp,'nsamp',1000,'plots',1,'labels',labels);
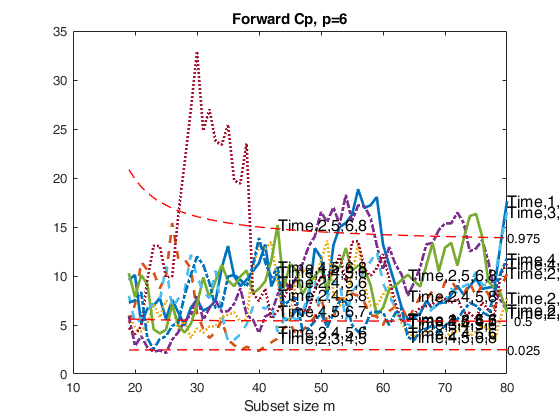
Extract the best models of size 6 and 5 and plot monitoring of Cp.
Extract the best models of size 6 and 5 and plot monitoring of Cp.Extract 1000 subsets to initialize the search and use labels defined by the user. Exclude the searches of the models which were unacceptable for smallp=5.
X=load('ozone.txt');
% Transform the response using logs
X(:,end)=log(X(:,end));
% Add a time trend
X=[(-40:39)' X];
% Define y
y=X(:,end);
% Define X
X=X(:,1:end-1);
smallp=6;
labels={'Time','1','2','3','4','5','6','7','8'};
[Cpmon6]=FSRcp(y,X,smallp,'nsamp',1000,'plots',1,'labels',labels);
smallp=5;
[Cpmon5]=FSRcp(y,X,smallp,'nsamp',1000,'Excl',Cpmon6.Ajout,'plots',1,'labels',labels);
Warning: Rank deficient, rank = 4, tol =  1.863022e-11.
Warning: Rank deficient, rank = 4, tol =  2.348919e-11.
Warning: Rank deficient, rank = 4, tol =  2.868456e-11.
Warning: Rank deficient, rank = 4, tol =  3.410996e-11.

Customizing the graphical options.
In the following example we play with the graphical options
X=load('ozone.txt');
% Transform the response using logs
X(:,end)=log(X(:,end));
% Add a time trend
X=[(-40:39)' X];
% Define y
y=X(:,end);
% Define X
X=X(:,1:end-1);
labels={'Time','1','2','3','4','5','6','7','8'};
smallp=5;
[Cpmon]=FSRcp(y,X,smallp,'plots',1,'labels',labels,'xlimx',[40 80],'lwdenv',5,'lwd',4,'FontSize',25,'SizeAxesNum',20);
Input Arguments
y — Response variable.
Vector.
A vector with n elements that contains the response variable.
Missing values (NaN's) and infinite values (Inf's) are allowed, since observations (rows) with missing or infinite values will automatically be excluded from the computations.
Data Types: single| double
X — Predictor variables.
Matrix.
Data matrix of explanatory variables (also called 'regressors') of dimension (n x (bigP-1)).
The intercept will be added in automatic way, so that the dimension of the full model is bigP.
Rows of X represent observations, and columns represent variables. Missing values (NaN's) and infinite values (Inf's) are allowed, since observations (rows) with missing or infinite values will automatically be excluded from the computations.
Data Types: single| double
smallp — number of variables in the reduced models.
Scalar.
Scalar which specifies the number of variables in the reduced models which will be considered. For example, if smallp=3, all possible subsets containing 2 columns of matrix X will be considered. Notice that the dimension of each submodel is 3 because to each submodel the column of ones is added automatically.
Data Types: single| double
Name-Value Pair Arguments
Specify optional comma-separated pairs of Name,Value arguments.
Name is the argument name and Value
is the corresponding value. Name must appear
inside single quotes (' ').
You can specify several name and value pair arguments in any order as
Name1,Value1,...,NameN,ValueN.
 'intercept',false
, 'nocheck',true
, 'h',3
, 'lms',1
, 'lms',1
, 'nsamp',1000
, 'init',100 starts monitoring from step m=100
, 'aic',1
, 'labels',{'Time','1','2','3','4','5','6','7','8'}
, 'fin_step',1
, 'first_k',5
, 'Excl',[23; 24]
, 'ExclThresh',0.6
, 'plots',1
, 'labout',1
, 'quant',0.1
, 'steps',[4 8]
, 'titl','my title'
, 'labx','my label'
, 'laby','my label'
, 'xlimx',[0 1]
, 'ylimx',[0 1]
, 'linewidth',6
, 'lwdenv',6
, 'FontSize',20
, 'SizeAxesNum',30
, 'selunitcolor',{'b';'g';'r'}
, 'selunittype',{'-';'--';':';'-.'}
intercept
—Indicator for constant term.true (default) | false.
Indicator for the constant term (intercept) in the fit, specified as the comma-separated pair consisting of 'Intercept' and either true to include or false to remove the constant term from the model.
Example: 'intercept',false
Data Types: boolean
nocheck
—Check input arguments.boolean.
If nocheck is equal to true, no check is performed on matrix y and matrix X. Note that y and X are left unchanged. In other words, the additional column of ones for the intercept is not added. As default nocheck=true.
Example: 'nocheck',true
Data Types: boolean
h
—number of observations that have determined the least
trimmed squares estimator.integer.
h is an integer greater than smallp+1 but smaller then n. The default value of h is [(n+smallp+1)/2]
Example: 'h',3
Data Types: double
lms
—Criterion to use to find the initial subset to
initialize the search.scalar.
If lms=1 (default) Least Median of Squares is computed, else Least Trimmed of Squares is computed.
Example: 'lms',1
Data Types: double
nomes
—Displaying time message.scalar.
If nomes is equal to 1 (default) no message about estimated time to compute LMS (LTS) for each considered model is displayed, else a message about estimated time is displayed.
Example: 'lms',1
Data Types: double
nsamp
—Number of subsamples which will be extracted to find the
robust estimator.scalar.
If nsamp=0 all subsets will be extracted.
They will be (n choose smallp).
Remark: if the number of all possible subset is <1000, the default is to extract all subsets, otherwise just 1000.
Example: 'nsamp',1000
Data Types: double
init
—Search initialization.scalar.
It specifies the initial subset size to start monitoring the required quantities, if init is not specified it will be set equal to smallp+1, if the sample size is smaller than 40;
min(3*smallp+1,floor(0.5*(n+smallp+1))), otherwise.
Example: 'init',100 starts monitoring from step m=100
Data Types: double
aic
—Akaike's information criterion.scalar.
If aic=1 the value of AIC is also stored in each step of the search else (default) only Mallows Cp is stored
Example: 'aic',1
Data Types: double
labels
—names of the explanatory variables.cell array of strings.
Cell array of strings of length bigP-1 containing the names of the explanatory variables. If labels is a missing value, the following sequence of strings will be automatically created for X (1,2,3,4,5,6,7,8,9,A,B,C,D,E,E,G,H,I,J,K,...,Z)
Example: 'labels',{'Time','1','2','3','4','5','6','7','8'}
Data Types: cell
fin_step
—portion of the search which has to be
monitored to choose the best models.scalar.
If fin_step is an integer greater or equal 1, it refers to the number of steps.
For example, if fin_step=10, the program considers the last 10 steps to choose the best models.
If fin_step is a real number alpha (0<alpha<0.5) in the interval (0 0.5] than the program considers the last round(n*alpha) steps. As default fin_step=round(n*0.2) that is the last 20% of the steps are considered.
Remark1: the number of best models to consider is controlled by scalar first_k (see below).
Remark2: if fin_step is an empty value, no selection is done and all trajectories of Cp are displayed (in this case the value of first_k below is ignored, all models are considered of interest and output matrix outCp.Ajout is equal to an empty value).
Example: 'fin_step',1
Data Types: double
first_k
—number of best models to
consider in each of the last fin_step.scalar.
For example, if first_k=5 in each of the last fin_step, the models which had the 5 smallest values of Cp are considered.
As default first_k=3
Example: 'first_k',5
Data Types: double
Excl
—Matrix which contains the models which surely do not have
to be considered.matrix.
As default Excl='' For example if smallp=3, bigP=6 and Excl = [23; 24; 27]; the three models 23, 24, and 27 are skipped
Example: 'Excl',[23; 24]
Data Types: double
ExclThresh
—Exclusion threshold.scalar.
Exclusion threshold associated to the upper percentage point of the F distribution of Cp which defines the threshold for declaring models as unuseful.
The default value of ExclThresh is 0.99999 that is the models whose minimum value of Cp in the part of the search defined by fin_step is above ExclThresh are stored in output matrix outCp.Ajout. Notice that ExclThresh must be smaller than 1
Example: 'ExclThresh',0.6
Data Types: double
plots
—Plot on the screen.scalar.
If plots==1 a plot is created on the screen which contains the trajectories of Cp monitored along the search with confidence bands.
If plots==2 two plots are generated. The first contains the trajectories of Cp monitored along the search with confidence bands. The second contains the trajectories of AIC monitored along the search else (default) no plot is shown on the screen
Example: 'plots',1
Data Types: double
labout
—If labout=1 the output LABOUT contains the list of models
whose Cp values are inacceptable.scalar.
Default: no model is created.
Remark: the options below only work if plots is equal 1.
Example: 'labout',1
Data Types: double
quant
—It specifies the quantiles which are used to
produce Cp envelopes.vector.
The elements of quant are numbers between 0 and 1. The default value of quant is quant=[0.025 0.5 0.975];
Example: 'quant',0.1
Data Types: double
steps
—Steps to add labels.vector.
It specifies in which steps of the plot, which monitors Cp, it is necessary to include the labels of the models which have been previously chosen.
The default is to write the labels of the models in steps round([n*0.6 n*0.8 n]);
Example: 'steps',[4 8]
Data Types: double
titl
—a label for the title.character.
default is ['Forward Cp' p= num2str(smallp)]
Example: 'titl','my title'
Data Types: char
labx
—a label for the x-axis.character.
default: 'Subset size m'
Example: 'labx','my label'
Data Types: double
xlimx
—minimum and maximum on the x axis.vector.
Default value is '' (automatic scale)
Example: 'xlimx',[0 1]
Data Types: double
ylimy
—minimum and maximum on the y axis.vector.
Default value is '' (automatic scale)
Example: 'ylimx',[0 1]
Data Types: double
lwd
—linewidth of the curves which contain the score test.scalar.
Default line width=2
Example: 'linewidth',6
Data Types: double
lwdenv
—width of the lines associated
with the envelopes.scalar.
Default is lwdenv=1
Example: 'lwdenv',6
Data Types: double
FontSize
—font size of the labels of
the axes and of the labels inside the plot.scalar.
Default value is 12
Example: 'FontSize',20
Data Types: double
SizeAxesNum
—size of the numbers of the axes.scalar.
Default value is 10
Example: 'SizeAxesNum',30
Data Types: double
selunitcolor
—colors to be used for the Cp trajectories.cell array of strings.
If selunittype is not specified or if it is an empty value default Matlab colors are used.
Example: 'selunitcolor',{'b';'g';'r'}
Data Types: cell
selunittype
—line types of the Cp trajectories.cell array of strings.
If selunittype is not specified or if it is an empty value all possible line styles are used.
Example: 'selunittype',{'-';'--';':';'-.'}
Data Types: cell
Output Arguments
outCp — description
Structure
Containing the following fields:
| Value | Description |
|---|---|
MAL |
(n-init+1) x (k+1) matrix. Mallows Cp monitored along the search: 1st col is fwd search index; 2nd col is associated with first selected model; 3rd col is associated with second selected model; ...; (k+1)th col is associated with k-th selected model. Notice that k<=(n choose smallp) and that all models contain the constant. |
AIC |
(n-init+1) x (k+1) matrix. AIC monitored along the search: 1st col is fwd search index; 2nd col is associated with first selected model; 3rd col is associated with second selected model; ...; (k+1)th col is associated with k-th selected model. Remark 1: k<=(n choose smallp). Remark 2: all models contain the constant. Remark 3: matrix AIC is produced only if input option aic=1. |
UnAll |
cell of dimension k. Each element of the cell is a (n-init) x 11 matrix containing the unit(s) included in the subset at each step of the search. REMARK: in every step the new subset is compared with the old subset. Un contains the unit(s) present in the new subset but not in the old one. |
LAB |
cell array of strings of length k containing the labels of the models which have been extracted. First element of LAB is associated with second column of matrix MAL... |
Ajout |
numeric matrix which contains the list of the models whose Cp values are inacceptable. The number of columns of matrix Ajout is equal to smallp-1 This information is useful because in this way it is possible to skip the computation of the submodels of the rows of matrix Ajout. For example, if smallp=3, bigP=6 and Ajout = [ 23; 24; 27 ] the three models 23, 24, and 27 always have Cp values much greater than the threshold (that is variables 2,3,4,7 are considered unimportant). |
LABout |
cell array of strings which contains as strings the list of models which are unacceptable. LABout is created only if input option labout=1. |
References
Atkinson, A.C. and Riani, M. (2008), A robust and diagnostic information criterion for selecting regression models, "Journal of the Japan Statistical Society", Vol. 38, pp. 3-14.