It contains the following fields.
| Value |
Description |
CLACLA |
matrix of size length(kk)-times
length(cc) containinig the values of the penalized
classification likelihood (CLA).
This field is linked with
out.IDXCLA.
|
IDXCLA |
cell of size length(kk)-times
length(cc). Each element of the cell is a vector of
length n containinig the assignment of each unit using
the classification model.
Remark: fields CLACLA and IDXCLA are linked together.
CLACLA and IDXCLA are compulsory just if optional input
argument 'whichIC' is 'CLACLA' or 'ALL'
|
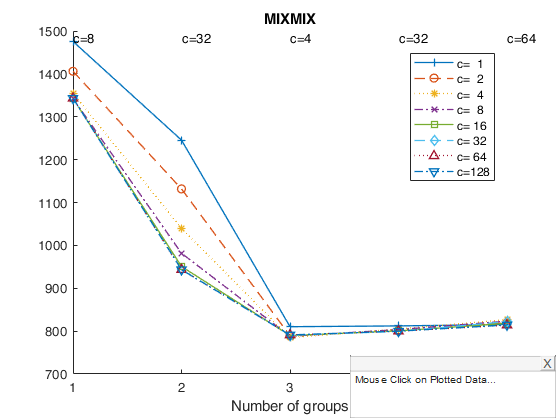
MIXMIX |
matrix of size length(kk)-times
length(cc) containinig the value of the penalized
mixture likelihood (BIC). This field is linked with
out.IDXMIX.
|
MIXCLA |
matrix of size length(kk)-times
length(cc) containinig the value of the ICL. This field
is linked with out.IDXMIX.
|
IDXMIX |
cell of size length(kk)-times
length(cc). Each element of the cell is a vector of
length n containinig the assignment of each unit using
the mixture model.
Remark 1: fields MIXMIX and IDXMIX are linked together.
MIXMIX and IDXMIX are compulsory just if optional input
argument 'whichIC' is 'CLACLA' or 'ALL'.
Remark 2: fields MIXCLA and IDXMIX are linked together.
MIXCLA and IDXMIX are compulsory just if optional input
argument 'whichIC' is 'MIXCLA' or 'ALL'.
|
kk |
vector containing the values of k (number of
components) which have been considered.
|
cc |
scalar or vector containing the values of c (values of the
restriction factor) which have been considered.
|
Y |
original n-times-v data matrix on which the IC
(Information criterion) has
been computed
|
alpha |
scalar or vector containing the values of
trimming which have been considered. If input structure
IC comes from tclustreg, then trimming refers to first
level trimming (likelihood trimming).
|
nameY |
cell of length(size(Y,2)) containing the names
of the variables of original matrix Y
|
Data Types: struct
Specify optional comma-separated pairs of Name,Value arguments.
Name is the argument name and Value
is the corresponding value. Name must appear
inside single quotes (' ').
You can specify several name and value pair arguments in any order as
Name1,Value1,...,NameN,ValueN.
Example:
 'whichIC','ALL'
, 'tag','myplot'
, 'ylimy',[0 100]
, 'datatooltip',''
, 'databrush',1
, 'nameY',{'myY1', 'myY2'}
Possible values for whichIC are:
'CLACLA' = in this case best solutions are referred to
the classification likelihood.
'MIXMIX' = in this case in this case best solutions are
referred to the mixture likelihood (BIC).
'MIXCLA' = in this case in this case best solutions are
referred to ICL.
'ALL' = in this case best solutions both three solutions using
classification and mixture likelihood are produced.
In output structure out all the three matrices
out.MIXMIXbs, out.CLACLAbs and out.MIXCLAbs are given.
The default value of 'whichIC' is 'ALL'
Example: 'whichIC','ALL'
Data Types: character
String which identifies the
handle of the plot which is about to be created. The
default is to use tag 'pl_IC'.
Note that if the program finds a plot which has a tag
equal to the one specified by the user, then the output
of the new plot overwrites the existing one in the same
window else a new window is created.
Example: 'tag','myplot'
Data Types: char
Vector with two
elements controlling minimum and maximum of the y axis.
If ylimy is empty automatic scale is used
Example: 'ylimy',[0 100]
Data Types: double
The default is datatooltip=''.
If datatooltip = 1, the user can select with the
mouse a solution in order to
have the following information:
1) value of k which has been selected
2) value of c which has been selected
3) values of the information criterion
4) frequency distribution of the associated
classification
If datatooltip is a structure it may contain the
following the fields
| Value |
Description |
DisplayStyle |
Determines how the data
cursor displays. datatip | window.
- datatip displays data cursor
information in a small yellow text box attached to a
black square marker at a data point you interactively
select.
- window displays data cursor information for the
data point you interactively select in a floating
window within the figure.
|
SnapToDataVertex |
Specifies whether the
data cursor snaps to the nearest data value or is
located at the actual pointer position. on | off.
- on data cursor snaps to the nearest data value
- off data cursor is located at the actual pointer
position.
(see the MATLAB function datacursormode or the examples
below). Default values are datatooltip.DisplayStyle =
'Window' and datatooltip.SnapToDataVertex = 'on'.
|
Example: 'datatooltip',''
Data Types: scalar double or struct
If databrush is an empty value (default), no brushing
is done. The activation of this option
(databrush is a scalar or a structure) enables the user
to select a set of values of IC in the current plot and
to see the corresponding classification highlighted in
the scatter plot matrix (spm). If spm does not exist it
is automatically created. Please, note that the window
style of the other figures is set equal to that which
contains the IC plot. In other words, if the IC plot is
docked all the other figures will be docked too.
DATABRUSH IS A SCALAR. If databrush is a scalar the
default selection tool is a rectangular brush and it is
possible to brush only once (that is persist='').
DATABRUSH IS A STRUCTURE. If databrush is a structure,
it is possible to use all optional arguments of
function selectdataFS and the following optional
arguments: - databrush.persist = repeated brushing
enabled. Persist is an empty value or a scalar
containing the strings 'on' or 'off'.
The default value of persist is '', that is brushing
is allowed only once.
If persist is 'on' or 'off' brushing can be done as
many time as the user requires.
If persist='on' then the unit(s) currently brushed
are added to those previously brushed. it is
possible, every time a new brushing is done, to use a
different color for the brushed solutions.
If persist='off' every time a new brush is performed
units previously brushed are removed.
- databrush.Label = add labels (i.e. x=value of k and
y=values of IC) of brushed solutions in the ICplot.
Character. [] (default) | '1'.
- dispopt = string which controls how to fill the
diagonals in the scatterplot matrix of the brushed
solutions. Set dispopt to 'hist' (default) to plot
histograms, or 'box' to plot boxplots.
Example: 'databrush',1
Data Types: single | double | struct
Cell array of strings
containing the labels of the
variables. As default value, the labels which are added
are Y1, ..., Yv.
Example: 'nameY',{'myY1', 'myY2'}
Data Types: cell


 Plot BIC, ICL and CLA for for Geyser data with all default options.