txmerge
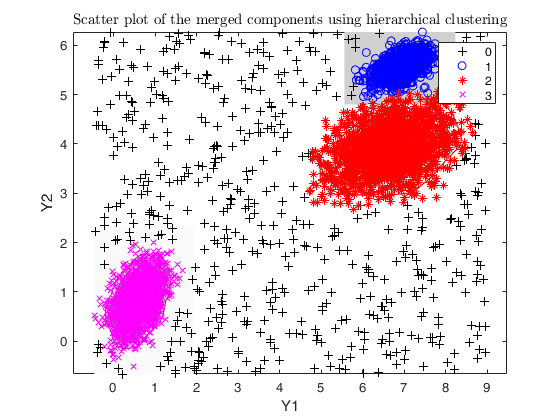
txmerge performs a (hierarchical) merging of the inflated number of components found by tkmeans or tclust
Description
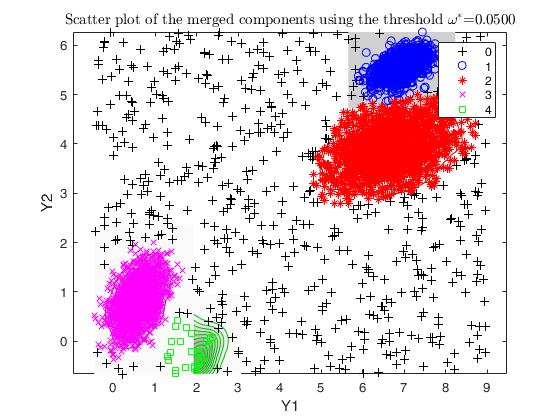
The function txmerge performs either a hierarchical merging of the k components found by tkmeans/TCLUST into g groups, or if g is a decimal number between 0 and 1 and DEMP is used as a distance it performs the merging phase according to such threshold.
Examples
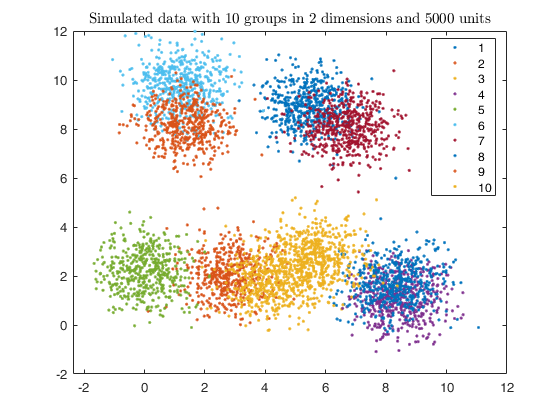
 Example using txmerge with euclidean distances.
Example using txmerge with euclidean distances.
close all
% Specify k cluster in v dimensions with n obs
k = 10;
v = 2;
n = 5000;
% Generate homogeneous and spherical clusters
rng(100, 'twister');
outMS = MixSim(k, v, 'sph', true, 'hom', true, 'int', [0 10], 'Display', 'off', 'BarOmega', 0.05, 'Display','off');
% Simulating data
[X, id] = simdataset(n, outMS.Pi, outMS.Mu, outMS.S);
% Plotting data
gscatter(X(:,1), X(:,2), id);
str = sprintf('Simulated data with %d groups in %d dimensions and %d units', k, v, n);
title(str,'Interpreter','Latex');
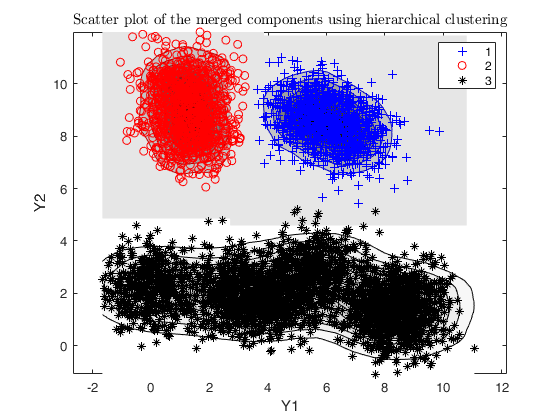
% merging algorithm based on hierarchical clustering
g = 3;
out = txmerge(X, k*5, g, 'dist', 1, 'plots', 'contourf');
Total estimated time to complete trimmed k means: 15.58 seconds
------------------------------
Warning: Number of subsets without convergence equal to 36.6667%
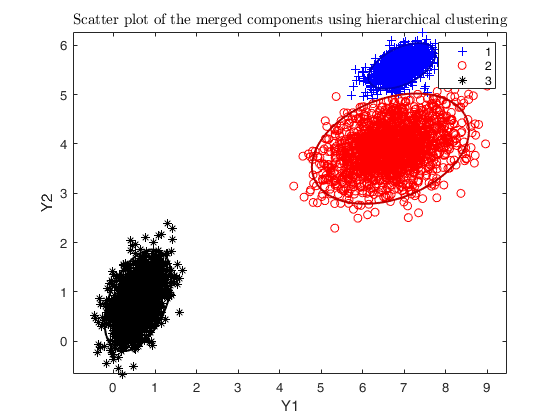
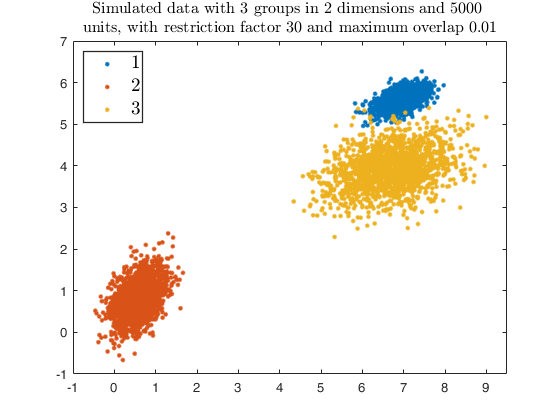
Example using txmerge with additional arguments in the call to tkmeans.
Example using txmerge with additional arguments in the call to tkmeans.
close all
% Specify k cluster in v dimensions with n obs
g = 3;
v = 2;
n = 5000;
% null trimming and noise level
alpha0 = 0;
% restriction factor
restr = 30;
% Maximum overlap
maxOm = 0.005;
% Generate heterogeneous and elliptical clusters
rng(500, 'twister');
outMS = MixSim(g, v, 'sph', false, 'restrfactor', restr, 'int', [0 10], ...
'Display', 'off', 'MaxOmega', maxOm, 'Display','off');
% Simulating data
[X, id] = simdataset(n, outMS.Pi, outMS.Mu, outMS.S);
% Plotting data
gg = gscatter(X(:,1), X(:,2), id);
str = sprintf('Simulated data with %d groups in %d dimensions and %d \nunits, with restriction factor %d and maximum overlap %.2f', ...
g, v, n, restr, maxOm);
title(str,'Interpreter','Latex', 'fontsize', 12);
set(findobj(gg), 'MarkerSize',10);
legend1 = legend(gca,'show');
set(legend1,'LineWidth',1,'Interpreter','latex','FontSize',14, 'Location', 'northwest')
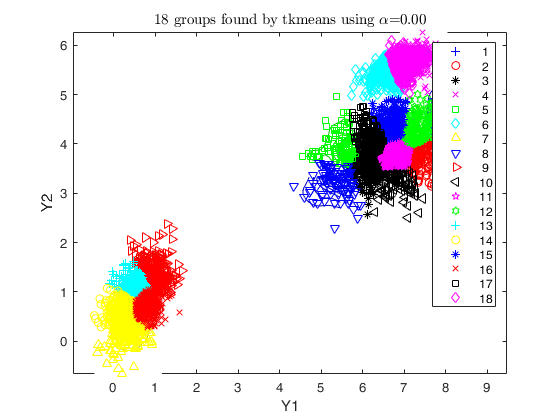
% number of components searched by tkmeans
k = g * 6;
% additional input for tkmeans
txOpt = struct;
txOpt.reftol = 0.0001;
txOpt.msg = 1;
tkmplots = struct;
tkmplots.type = 'contourf';
tkmplots.cmap = [0.3 0.2 0.4; 0.4 0.5 0.5; 0.1 0.7 0.9; 0.5 0.3 0.8; 1 1 1];
txOpt.plots = tkmplots;
txOpt.nomes = 0;
% saving tkmeans output
txOut = 1;
txsol = txmerge(X, k, g, 'txOpt', txOpt, 'plots', 'ellipse');
cascade;
Total estimated time to complete trimmed k means:  0.43 seconds
------------------------------
Warning: Number of subsets without convergence equal to 21.6667%

Related Examples
Example using txmerge based on TCLUST and 'weights' linkage
close all
Specify k cluster in v dimensions with n obs
g = 3;
v = 2;
n = 5000;
null trimming and noise level
alpha0 = 0;
restriction factor
restr = 30;
Maximum overlap
maxOm = 0.
Example using txmerge based on TCLUST and 'weights' linkage
close all
Specify k cluster in v dimensions with n obs
g = 3;
v = 2;
n = 5000;
null trimming and noise level
alpha0 = 0;
restriction factor
restr = 30;
Maximum overlap
maxOm = 0.close all
% Specify k cluster in v dimensions with n obs
g = 3;
v = 2;
n = 5000;
% null trimming and noise level
alpha0 = 0;
% restriction factor
restr = 30;
% Maximum overlap
maxOm = 0.005;
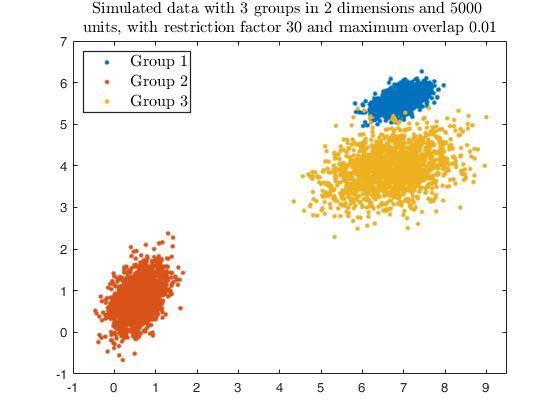
% Generate heterogeneous and elliptical clusters
rng(500, 'twister');
outMS = MixSim(g, v, 'sph', false, 'restrfactor', restr, 'int', [0 10], ...
'Display', 'off', 'MaxOmega', maxOm, 'Display','off');
% Simulating data
[X, id] = simdataset(n, outMS.Pi, outMS.Mu, outMS.S);
% Plotting data
gg = gscatter(X(:,1), X(:,2), id);
str = sprintf('Simulated data with %d groups in %d dimensions and %d \nunits, with restriction factor %d and maximum overlap %.2f', ...
g, v, n, restr, maxOm);
title(str,'Interpreter','Latex', 'fontsize', 12);
set(findobj(gg), 'MarkerSize',10);
legend1 = legend(gca,'Group 1','Group 2','Group 3');
set(legend1,'LineWidth',1,'Interpreter','latex','FontSize',12, 'Location', 'northwest')
% number of components searched by tkmeans
k = g * 3;
% additional input for clusterdata (i.e. hierOpt)
linkagearg = 'weights';
txsol = txmerge(X, k, g, 'tkm', 1,'linkagearg', linkagearg, 'plots', 'ellipse');
cascade;
Total estimated time to complete trimmed k means:  0.64 seconds
------------------------------
Warning: Number of subsets without convergence equal to 37%
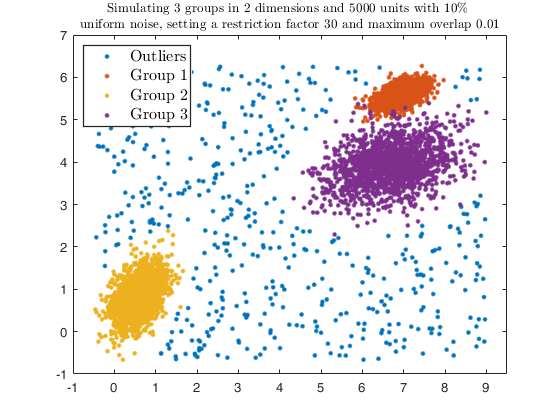
Example using txmerge Euclidean distances or DEMP in the presence of contamination.
Example using txmerge Euclidean distances or DEMP in the presence of contamination.
close all
% Specify k cluster in v dimensions with n obs
g = 3;
v = 2;
n = 5000;
% 10 percent trimming and uniform noise
alpha = 0.1;
noise = alpha*n;
% restriction factor
restr = 30;
% Maximum overlap
maxOm = 0.005;
% Generate heterogeneous and elliptical clusters
rng(500, 'twister');
outMS = MixSim(g, v, 'sph', false, 'restrfactor', restr, 'int', [0 10], ...
'Display', 'off', 'MaxOmega', maxOm, 'Display','off');
% Simulating data
[X,id] = simdataset(n, outMS.Pi, outMS.Mu, outMS.S, 'noiseunits', noise);
% Plotting data
gg = gscatter(X(:,1), X(:,2), id);
str = sprintf('Simulating %d groups in %d dimensions and %d units with %d%s \nuniform noise, setting a restriction factor %d and maximum overlap %.2f', ...
g, v, n, alpha*100, '\%', restr, maxOm);
title(str,'Interpreter','Latex', 'fontsize', 10);
set(findobj(gg), 'MarkerSize',10);
legend1 = legend(gca,'Outliers','Group 1','Group 2','Group 3');
set(legend1,'LineWidth',1,'Interpreter','latex','FontSize',12, 'Location', 'northwest')
% fixing the number of components searched by tkmeans
k = g * 6;
% txmerge with hierarchical merging and trimming equal to the level of noise
txsol1 = txmerge(X, k, g, 'alpha', alpha, 'plots', 'contourf');
% txmerge using a cutoff g to detect the clusters based on DEMP
g = 0.05;
txsol2 = txmerge(X, k, g, 'alpha', alpha, 'dist', 1', 'plots', 'contourf');
cascade;
Total estimated time to complete trimmed k means:  8.46 seconds
------------------------------
Warning: Number of subsets without convergence equal to 38%
Total estimated time to complete trimmed k means:  6.62 seconds
------------------------------
Warning: Number of subsets without convergence equal to 36%
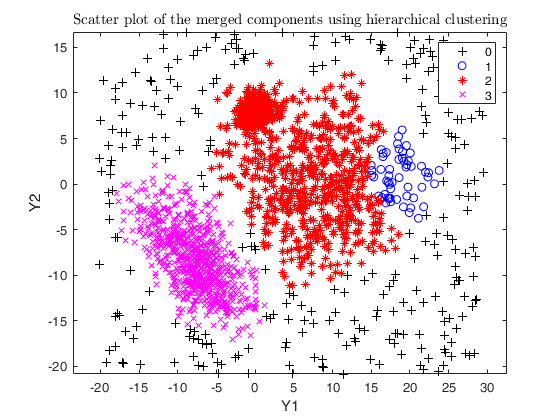
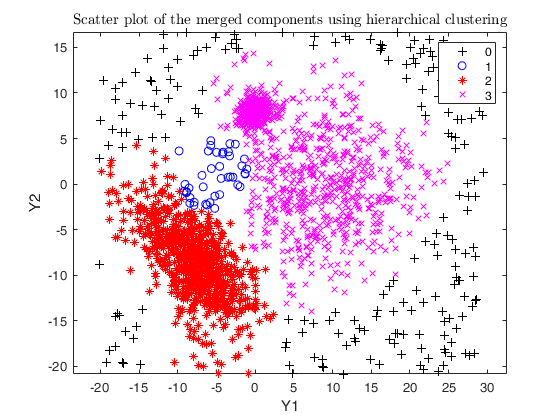
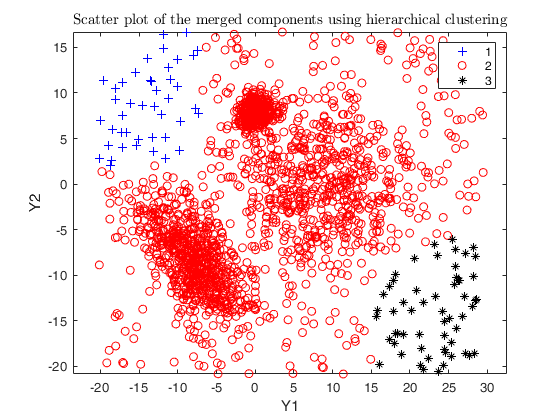
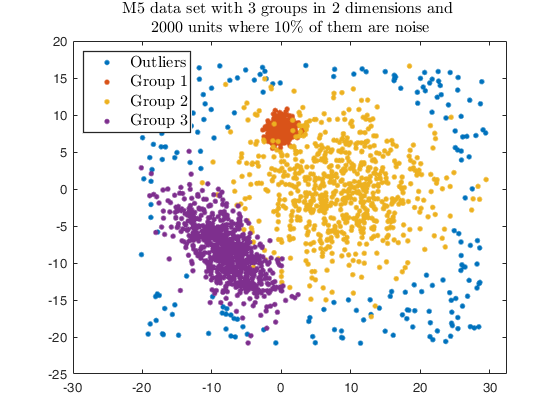

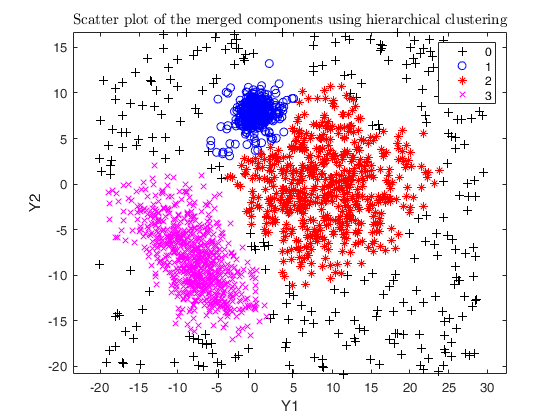
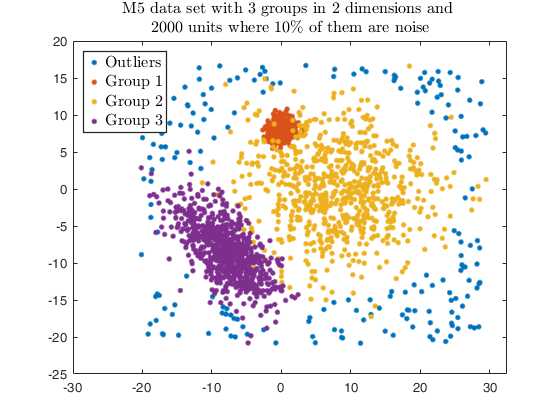
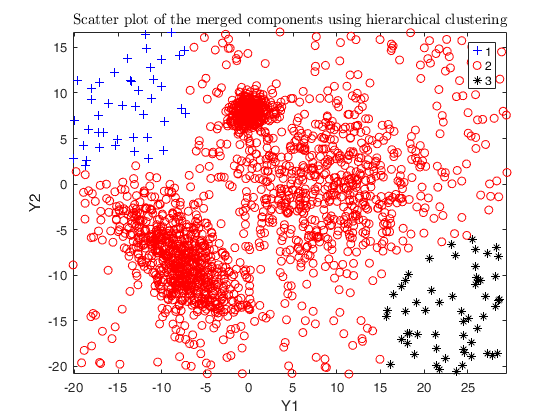
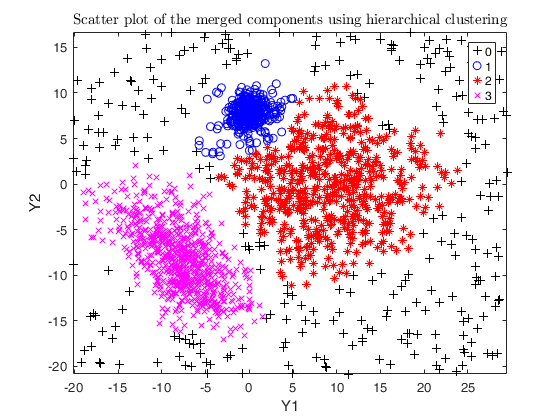
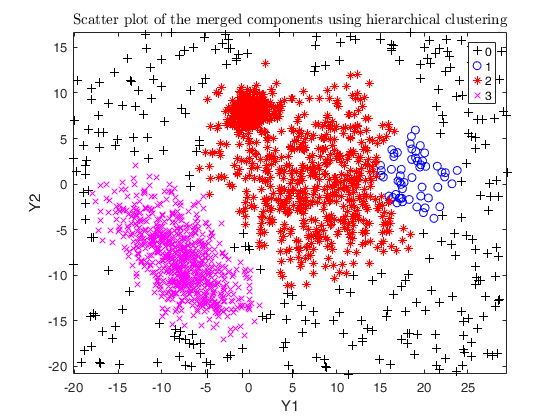
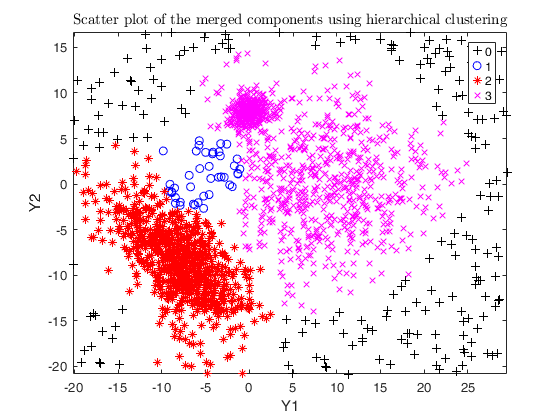
Example using txmerge on the M5 dataset using different strategies.
Example using txmerge on the M5 dataset using different strategies.
close all
Y = load('M5data.txt');
id = Y(:,3);
Y = Y(:, 1:2);
g = max(id);
n = length(Y);
noise = length(Y(id==0, 1));
v = 2; % dimensions
id(id==0) = -1; % changing noise label
gg = gscatter(Y(:,1), Y(:,2), id);
str = sprintf('M5 data set with %d groups in %d dimensions and \n%d units where %d%s of them are noise', g, v, n, noise/n*100, '\%');
title(str,'Interpreter','Latex', 'fontsize', 12);
set(findobj(gg), 'MarkerSize',12);
legend1 = legend(gca,'Outliers','Group 1','Group 2','Group 3');
set(legend1,'LineWidth',1,'Interpreter','latex','FontSize',12, 'Location', 'northwest')
% number of components to search
k = g*5;
% null trimming and noise level
alpha0 = 0;
% mimimum overlap cut-off value between pair of merged components
txsol1= txmerge(Y, k, g, 'alpha', alpha0, 'txOut', 1, 'plots', 1);
% setting alpha equal to noise level (usually not effective here)
alpha = noise/n;
txsol2= txmerge(Y, k, g, 'alpha', alpha, 'txOut', 1, 'plots', 1);
% setting alpha greater than the noise level
txsol3 = txmerge(Y, k, g, 'alpha', alpha+0.04, 'txOut', 1, 'plots', 1);
% using DEMP instead (usually effective)
txsol3 = txmerge(Y, k, g, 'alpha', alpha+0.04, 'txOut', 1, 'dist', 1, 'plots', 1);
cascade;
Total estimated time to complete trimmed k means:  0.16 seconds
------------------------------
Warning: Number of subsets without convergence equal to 36%
Total estimated time to complete trimmed k means:  1.81 seconds
------------------------------
Warning: Number of subsets without convergence equal to 39%
Total estimated time to complete trimmed k means:  1.65 seconds
------------------------------
Warning: Number of subsets without convergence equal to 38.6667%
Total estimated time to complete trimmed k means:  0.12 seconds
------------------------------
Warning: Number of subsets without convergence equal to 36%


Input Arguments
Output Arguments
References
Insolia, L., Perrotta, D. (2023), Tk-Merge: Computationally Efficient Robust Clustering Under General Assumptions. Advances in Intelligent Systems and Computing, vol 1433. Springer, Cham.
See Also
dempk
|
tkmeans
|
clusterdata
|
tclusteda
|
overlapmap