GUIpowermean
GUIpowermean shows the necessary calculations to obtain the power (generalized) mean in a GUI.
Description
The power mean (also known as generalized mean, or Holder mean or Kolmogorov-Negumo function of the mean), is an abstraction of the Pythagorean means. It includes the harmonic $(s=-1)$, geometric ($s\rightarrow 0$), and arithmetic ($s=1$), quadratic ($s=2$), cubic mean ($s=3$). When $s \rightarrow -\infty$ the power mean tends to $x_{min}$ and when $s\rightarrow +\infty$ the power mean tends to $x_{max}$. http://en.wikipedia.org/wiki/Generalized_mean
Examples
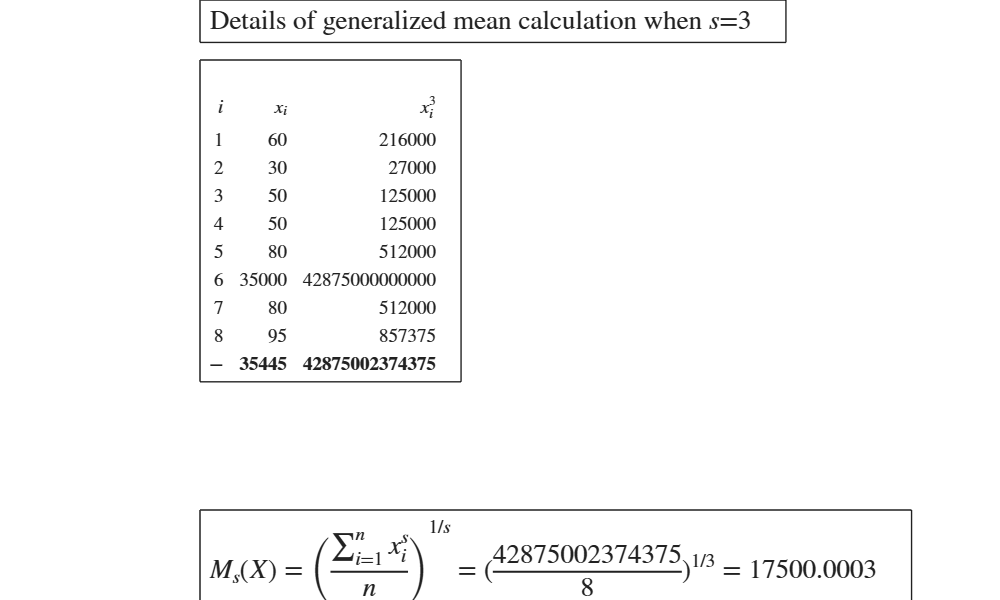
 Example of use of the cubic mean.
Example of use of the cubic mean.See page 92 of [MRZ]
x=[60 30 50 50  80 35000  80 95];
out=GUIpowermean(x,3);
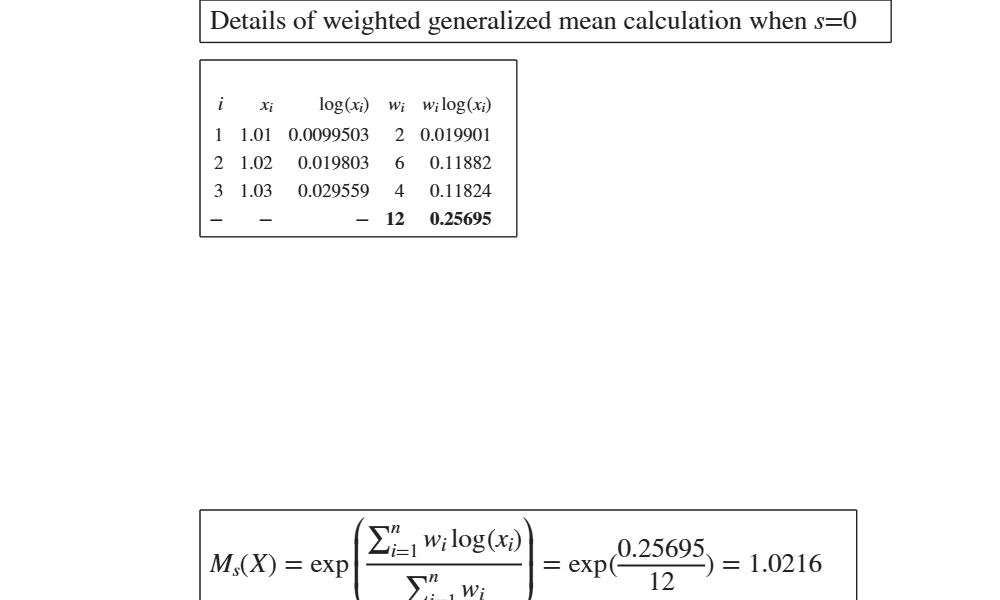
Example of use of weighted geometric mean.
Example of use of weighted geometric mean.See page 82 of [MRZ]
x=[1.01 1.02 1.03];
w=[2 6 4];
out=GUIpowermean(x,0,w);
Input Arguments
Output Arguments
References
Milioli, M.A., Riani, M., Zani, S. (2019), "Introduzione all'analisi dei dati statistici (Quarta edizione ampliata)". [MRZ]